Chicken Road 2
Outcome generation: independently unverified by us.
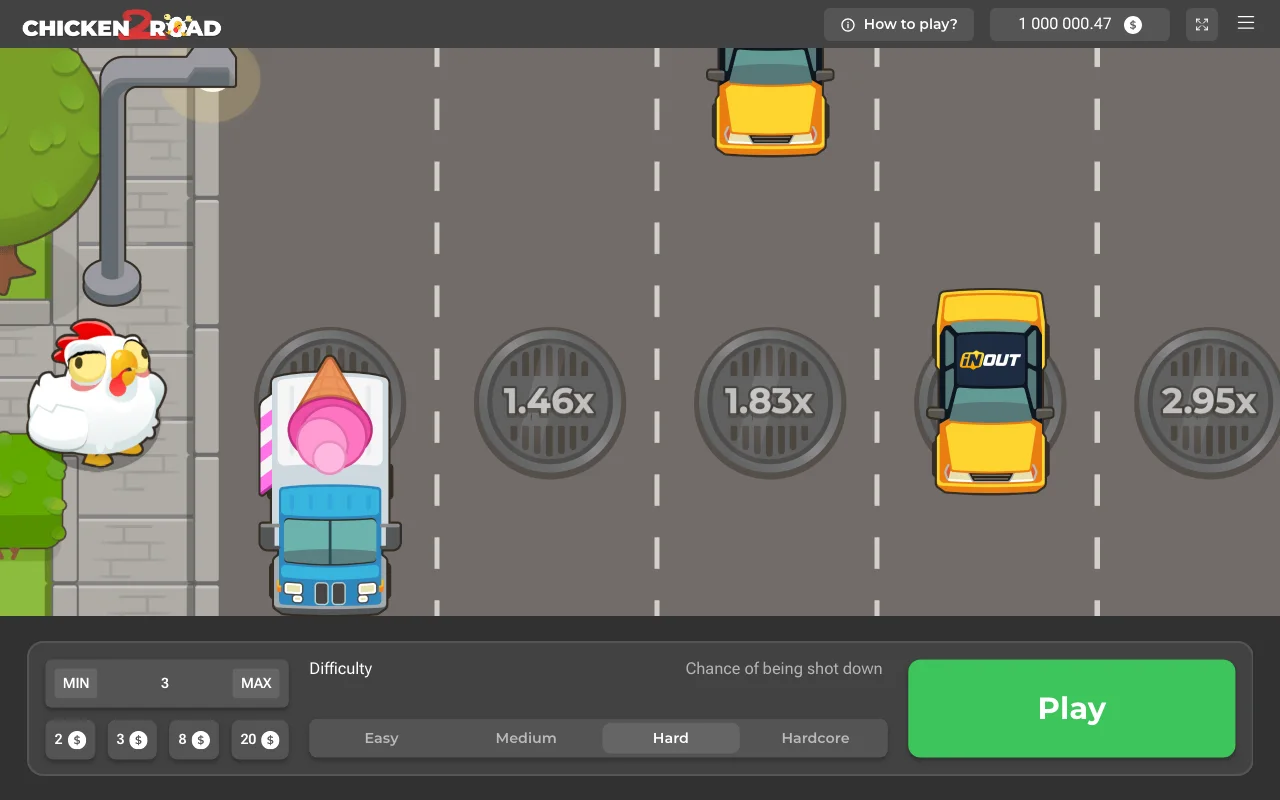
Game 2 of 2 at Chicken Road Wins · InOut Games · 2025
Chicken Road 2 is the InOut sequel to the crossing gambling game. After a successful step, you can collect the amount shown or risk losing it by attempting the next move. A failure closes the round and loses the stake. The broad mechanic is familiar, but the sequel changes what each position offers.
Chicken Road Wins research team · Our approach to comparing play
Free practice credits. No withdrawals. Adults 18+.
Developer-stated return: 95.5% · Maximum game payout: 20,000 USD · Pounds for personal spending plans: GBP (£); the game's provider limits are quoted in USD
Explore this game's detailsInOut released the sequel on 15 April 2025. The long-run house edge is 4.5%.
The four difficulties contain 30, 25, 22 and 18 positions for Easy, Medium, Hard and Daredevil. Provider stakes span 0.12–200 USD, with a maximum win of 20,000 USD. Those numbers deserve a fresh look even if you already recognise the original's buttons.
This Chicken Road 2 review puts each limit beside the decision it describes. A bigger maximum is still a ceiling, and extra road positions do not tell you how far the next attempt will travel.
Read Chicken Road 2 and InOut Games inside the play window. A casino lobby may place both versions close together, while promotional pictures can show other chicken-themed products. The actual title is a better reference than the look of the thumbnail.
The mode labels remain Easy, Medium, Hard and Daredevil. Their familiarity can make changed coefficients easy to overlook. If a value differs from the one you remember, check the game title and the selector before assuming a display fault.
The rules panel and ladder should agree about the selected title. On a phone, make them readable before a round starts. Comparing figures is simpler when the stake and current amount are not hidden beneath browser controls.
Easy is the sequel's longest route. It opens at ×1.01, then ×1.03 and ×1.06, later moving through ×1.98, ×2.12 and ×3.28. Towards the far end are ×6.50 and ×12.08 before the final ×23.24. The opening and endpoint show very different parts of the same ladder.
A long sequence gives more possible decision points before the end. It does not promise that every attempt gets through the early positions. The current collect amount follows progress already made, while a coefficient farther along still depends on more successful play.
In practice, try collecting during an attempt instead of treating the final tile as the only meaningful destination. Watching how the balance settles explains the control without needing a cash stake.
Medium starts at ×1.08, then ×1.21, ×1.37 and ×1.56. Its later sequence includes ×4.62, ×10.99 and ×53.82, ending at ×2,457. The route has 25 positions, so it is shorter than Easy but longer than the sequel's Hard and Daredevil roads.
Use the selected game's own table when comparing a position. The original Medium has a different length and coefficient sequence. A shared label does not make a value from one title valid for the other.
The last coefficient is not a promise of that amount on a new round. It must be reached, and multiplication still meets the 20,000 USD game ceiling. Read the cap before interpreting an impressive calculator result as a payment.
Hard has 22 positions, opening at ×1.18 and ending at ×62,162.09. Daredevil runs for 18 positions, from ×1.44 to ×3,608,855.25. The sequences rise far more sharply late in the route than the opening values alone suggest.
The early Hard coefficients include ×1.46, ×1.83 and ×2.31. Daredevil instead passes ×2.21, ×3.45 and ×5.53. Compare the next available amount with what you can collect now. Those are the figures you can act on, even when the final multiplier is much larger.
Neither label describes a level of arcade skill. Being familiar with the screen can help you read it, but it cannot steer a random failure away or train the next result to be favourable.
The sequel's provider range is 0.12–200 USD. A casino may display another supported account currency, so read the stake and currency in the actual window. No currency conversion is assumed here, and the same numerical value in your account currency would not be the same quote.
A personal allowance is money you have set aside for leisure spending. Deposit rules tell you what the casino accepts through a payment method. The game’s minimum is the smallest stake you can choose for one round. Keeping those three ideas apart prevents a low-looking stake from being used to justify an unrelated deposit.
Read any currency conversion and charges at the cashier before approving a payment. A higher permitted game maximum is not a reason to commit more than the amount you originally intended.
When checking the sequel review, Chicken Road 2 RTP is 95.5% per InOut. The multiplier ladders list position payouts, but do not supply all the probabilities needed to calculate a theoretical return. There is no substitute percentage here drawn from a promising-looking sequence.
The same limit applies to demo results. A run with a large collection can change an average sharply without answering the long-run return question. A shorter run with no large outcome can look entirely different. Neither should become a claimed provider RTP.
If another page attaches a percentage to Chicken Road 2, look for a direct InOut statement naming the exact title. The original's return belongs to the original. A comparison should show the sequel’s lower 95.5% return beside the original’s 98%.
The statistics blocks give the title, mode, dates and count for a run of demo attempts. Start there before looking at a largest multiplier. A peak without the surrounding attempts can make a very selective picture of what happened.
A survival line tells you how far those attempts progressed. It is not a prediction for a new crossing and should not be merged with another mode's line without its label. The coefficient ladder explains a different thing: the gross amount offered at a position.
Gross return includes the stake, before the payout ceiling applies. Keep that definition constant across a table, calculator and balance comparison. Mixing gross with gain above the stake can create a difference that is only arithmetic wording.
After a successful move, the amount at the current position can be collected under the rules. Continuing means that opportunity is exposed to another random move. A chosen target farther down the road is not yet money in the account.
A Telegram call, bot or overlay cannot reveal the next server-side result from public past play. If someone labels the next tile safe, the label is still a claim about an unknown outcome. It does not change the game's random system.
On a phone, arrange the view so you can read the amount without scrolling away from collect. If the connection pauses, wait for a settled status rather than issuing repeated inputs and becoming unsure which action was accepted.
When checking the sequel review, inOut does not supply a standalone Chicken Road app. Browser access can show the controls, while a casino may have its own account app. An unfamiliar installer with a similar name should not receive passwords or a payment to activate the game.
The concrete differences are longer roads, a higher minimum provider stake and a higher maximum win. Those may make the sequel worth comparing, but they do not establish a universal winner. The practical question is whether its visible sequence and controls interest you.
Use a demo to compare openings at a steady practice stake. Then read the full ladder and cap together. That is more informative than choosing a version from a single late-round clip or an advert showing the largest endpoint.
The lower 95.5% RTP remains part of the assessment. A neat-looking table should not conceal it, and a numerical score would not make it disappear. You can understand the sequel's mechanics without pretending every mathematical detail is available.
For adults aged 18+ only. Keep time and spending limits when reading about the sequel review; take breaks and never chase losses.
Outcome generation: independently unverified by us.
Check algorithm, commitments, seeds and nonce.
It is InOut’s sequel with four new multiplier ladders and the same broad move-or-collect format. Easy, Medium, Hard and Daredevil contain 30, 25, 22 and 18 positions respectively, with a 20,000 USD maximum win.
The percentage concerns long-run return, rather than a payment promised for a particular session.
The provider range is 0.12–200 USD. A casino’s deposit conditions and any displayed account currency are separate, so do not read those USD values as fixed converted amounts.
No. The position count describes the available ladder, not a promised distance for a stake. A crossing can fail early even when many positions remain on the screen.
No. The 20,000 USD provider maximum remains relevant even when stake multiplied by a coefficient gives a larger amount. A calculator result alone is not an unrestricted payment.
Use the casino holding the balance and its known support route. A game ladder can explain coefficients, but the operator handles its own payment requests, verification and account terms.
18+ only. Limit time and spending. Take breaks. Never chase losses.
Model: RTP ÷ multiplier. Independently unverified.
| Road position | Proportion of attempts getting here | Statistical uncertainty interval | Survival in the mathematical model |
|---|---|---|---|
| 1 | 96.2% | 95.11% – 97.06% | 94.55% |
| 2 | 93.93% | 92.61% – 95.03% | 92.72% |
| 3 | 90.53% | 88.95% – 91.91% | 90.09% |
| 4 | 87.27% | 85.48% – 88.86% | 86.82% |
| 5 | 83.13% | 81.15% – 84.94% | 83.04% |
| 6 | 80.13% | 78.04% – 82.07% | 80.25% |
| 7 | 76.53% | 74.32% – 78.61% | 77.02% |
| 8 | 73.53% | 71.24% – 75.7% | 73.46% |
| 9 | 70.6% | 68.24% – 72.85% | 70.74% |
| 10 | 66.73% | 64.31% – 69.07% | 67.25% |
| 11 | 63.67% | 61.2% – 66.06% | 64.53% |
| 12 | 60.67% | 58.17% – 63.11% | 61.22% |
| 13 | 57.2% | 54.68% – 59.68% | 57.88% |
| 14 | 54.2% | 51.67% – 56.71% | 54.57% |
| 15 | 51.2% | 48.67% – 53.72% | 51.62% |
| 16 | 48.13% | 45.61% – 50.66% | 48.23% |
| 17 | 45.33% | 42.83% – 47.86% | 45.05% |
| 18 | 42.67% | 40.19% – 45.19% | 41.89% |
| 19 | 39.53% | 37.09% – 42.03% | 38.66% |
| 20 | 36.47% | 34.07% – 38.93% | 35.37% |
| 21 | 33% | 30.67% – 35.42% | 32.26% |
| 22 | 30.13% | 27.86% – 32.5% | 29.12% |
| 23 | 26.33% | 24.17% – 28.62% | 25.81% |
| 24 | 23.13% | 21.07% – 25.33% | 23.24% |
| 25 | 20% | 18.05% – 22.1% | 20.58% |
| 26 | 16.33% | 14.55% – 18.29% | 17.72% |
| 27 | 13.07% | 11.45% – 14.87% | 14.69% |
| 28 | 10.13% | 8.71% – 11.76% | 11.42% |
| 29 | 7.13% | 5.94% – 8.55% | 7.91% |
| 30 | 3.67% | 2.83% – 4.74% | 4.11% |
| Road position | Proportion of attempts getting here | Statistical uncertainty interval | Survival in the mathematical model |
|---|---|---|---|
| 1 | 89.67% | 88.02% – 91.11% | 88.43% |
| 2 | 78.6% | 76.45% – 80.6% | 78.93% |
| 3 | 70.2% | 67.84% – 72.46% | 69.71% |
| 4 | 61.73% | 59.25% – 64.16% | 61.22% |
| 5 | 53.8% | 51.27% – 56.31% | 53.65% |
| 6 | 47% | 44.49% – 49.53% | 46.59% |
| 7 | 41.4% | 38.93% – 43.91% | 40.3% |
| 8 | 36.2% | 33.81% – 38.66% | 34.48% |
| 9 | 30.73% | 28.45% – 33.11% | 29.48% |
| 10 | 25.33% | 23.2% – 27.6% | 24.81% |
| 11 | 21.4% | 19.4% – 23.55% | 20.67% |
| 12 | 17.6% | 15.76% – 19.61% | 17.02% |
| 13 | 14% | 12.34% – 15.85% | 13.82% |
| 14 | 11.47% | 9.95% – 13.18% | 11.05% |
| 15 | 8.93% | 7.59% – 10.48% | 8.69% |
| 16 | 6.27% | 5.15% – 7.61% | 6.68% |
| 17 | 5.07% | 4.07% – 6.3% | 5.04% |
| 18 | 3.6% | 2.77% – 4.67% | 3.66% |
| 19 | 2.8% | 2.08% – 3.76% | 2.56% |
| 20 | 2.07% | 1.46% – 2.92% | 1.77% |
| 21 | 1.2% | 0.76% – 1.89% | 1.16% |
| 22 | 0.47% | 0.23% – 0.96% | 0.69% |
| 23 | 0.27% | 0.1% – 0.68% | 0.36% |
| 24 | 0.07% | 0.01% – 0.38% | 0.15% |
| 25 | 0% | 0% – 0.26% | 0.04% |
| Road position | Proportion of attempts getting here | Statistical uncertainty interval | Survival in the mathematical model |
|---|---|---|---|
| 1 | 81.67% | 79.63% – 83.54% | 80.93% |
| 2 | 64.67% | 62.21% – 67.05% | 65.41% |
| 3 | 52% | 49.47% – 54.52% | 52.19% |
| 4 | 41.07% | 38.6% – 43.58% | 41.34% |
| 5 | 31.2% | 28.91% – 33.59% | 32.37% |
| 6 | 23.67% | 21.58% – 25.88% | 25% |
| 7 | 17.2% | 15.37% – 19.19% | 19.02% |
| 8 | 13.07% | 11.45% – 14.87% | 14.34% |
| 9 | 9.47% | 8.09% – 11.05% | 10.56% |
| 10 | 6.4% | 5.27% – 7.75% | 7.63% |
| 11 | 4.67% | 3.71% – 5.85% | 5.38% |
| 12 | 3.4% | 2.6% – 4.44% | 3.7% |
| 13 | 1.93% | 1.35% – 2.76% | 2.47% |
| 14 | 1.13% | 0.71% – 1.81% | 1.59% |
| 15 | 0.53% | 0.27% – 1.05% | 0.98% |
| 16 | 0.33% | 0.14% – 0.78% | 0.57% |
| 17 | 0.13% | 0.04% – 0.48% | 0.31% |
| 18 | 0.13% | 0.04% – 0.48% | 0.16% |
| 19 | 0.07% | 0.01% – 0.38% | 0.07% |
| 20 | 0% | 0% – 0.26% | 0.03% |
| 21 | 0% | 0% – 0.26% | 0.01% |
| 22 | 0% | 0% – 0.26% | 0% |
| Road position | Proportion of attempts getting here | Statistical uncertainty interval | Survival in the mathematical model |
|---|---|---|---|
| 1 | 67.73% | 65.32% – 70.05% | 66.32% |
| 2 | 43.07% | 40.58% – 45.59% | 43.21% |
| 3 | 28.4% | 26.18% – 30.73% | 27.68% |
| 4 | 18.07% | 16.2% – 20.09% | 17.27% |
| 5 | 10.73% | 9.27% – 12.4% | 10.51% |
| 6 | 6.13% | 5.03% – 7.46% | 6.24% |
| 7 | 3.73% | 2.89% – 4.82% | 3.57% |
| 8 | 2.27% | 1.63% – 3.15% | 1.96% |
| 9 | 1.13% | 0.71% – 1.81% | 1.03% |
| 10 | 0.6% | 0.32% – 1.14% | 0.52% |
| 11 | 0.33% | 0.14% – 0.78% | 0.24% |
| 12 | 0.13% | 0.04% – 0.48% | 0.11% |
| 13 | 0.07% | 0.01% – 0.38% | 0.04% |
| 14 | 0% | 0% – 0.26% | 0.02% |
| 15 | 0% | 0% – 0.26% | 0.01% |
| 16 | 0% | 0% – 0.26% | 0% |
| 17 | 0% | 0% – 0.26% | 0% |
| 18 | 0% | 0% – 0.26% | 0% |
Chicken Road 2
| Road position | Coefficient offered | Survival in the mathematical model | Proportion of attempts getting here | Gross amount per stake unit |
|---|---|---|---|---|
| 1 | 1.01× | 94.55% | 96.2% | 0.972 |
| 2 | 1.03× | 92.72% | 93.93% | 0.968 |
| 3 | 1.06× | 90.09% | 90.53% | 0.96 |
| 4 | 1.1× | 86.82% | 87.27% | 0.96 |
| 5 | 1.15× | 83.04% | 83.13% | 0.956 |
| 6 | 1.19× | 80.25% | 80.13% | 0.954 |
| 7 | 1.24× | 77.02% | 76.53% | 0.949 |
| 8 | 1.3× | 73.46% | 73.53% | 0.956 |
| 9 | 1.35× | 70.74% | 70.6% | 0.953 |
| 10 | 1.42× | 67.25% | 66.73% | 0.948 |
| 11 | 1.48× | 64.53% | 63.67% | 0.942 |
| 12 | 1.56× | 61.22% | 60.67% | 0.946 |
| 13 | 1.65× | 57.88% | 57.2% | 0.944 |
| 14 | 1.75× | 54.57% | 54.2% | 0.949 |
| 15 | 1.85× | 51.62% | 51.2% | 0.947 |
| 16 | 1.98× | 48.23% | 48.13% | 0.953 |
| 17 | 2.12× | 45.05% | 45.33% | 0.961 |
| 18 | 2.28× | 41.89% | 42.67% | 0.973 |
| 19 | 2.47× | 38.66% | 39.53% | 0.976 |
| 20 | 2.7× | 35.37% | 36.47% | 0.985 |
| 21 | 2.96× | 32.26% | 33% | 0.977 |
| 22 | 3.28× | 29.12% | 30.13% | 0.988 |
| 23 | 3.7× | 25.81% | 26.33% | 0.974 |
| 24 | 4.11× | 23.24% | 23.13% | 0.951 |
| 25 | 4.64× | 20.58% | 20% | 0.928 |
| 26 | 5.39× | 17.72% | 16.33% | 0.88 |
| 27 | 6.5× | 14.69% | 13.07% | 0.849 |
| 28 | 8.36× | 11.42% | 10.13% | 0.847 |
| 29 | 12.08× | 7.91% | 7.13% | 0.862 |
| 30 | 23.24× | 4.11% | 3.67% | 0.852 |
| Road position | Coefficient offered | Survival in the mathematical model | Proportion of attempts getting here | Gross amount per stake unit |
|---|---|---|---|---|
| 1 | 1.08× | 88.43% | 89.67% | 0.968 |
| 2 | 1.21× | 78.93% | 78.6% | 0.951 |
| 3 | 1.37× | 69.71% | 70.2% | 0.962 |
| 4 | 1.56× | 61.22% | 61.73% | 0.963 |
| 5 | 1.78× | 53.65% | 53.8% | 0.958 |
| 6 | 2.05× | 46.59% | 47% | 0.963 |
| 7 | 2.37× | 40.3% | 41.4% | 0.981 |
| 8 | 2.77× | 34.48% | 36.2% | 1.003 |
| 9 | 3.24× | 29.48% | 30.73% | 0.996 |
| 10 | 3.85× | 24.81% | 25.33% | 0.975 |
| 11 | 4.62× | 20.67% | 21.4% | 0.989 |
| 12 | 5.61× | 17.02% | 17.6% | 0.987 |
| 13 | 6.91× | 13.82% | 14% | 0.967 |
| 14 | 8.64× | 11.05% | 11.47% | 0.991 |
| 15 | 10.99× | 8.69% | 8.93% | 0.982 |
| 16 | 14.29× | 6.68% | 6.27% | 0.896 |
| 17 | 18.96× | 5.04% | 5.07% | 0.961 |
| 18 | 26.07× | 3.66% | 3.6% | 0.939 |
| 19 | 37.24× | 2.56% | 2.8% | 1.043 |
| 20 | 53.82× | 1.77% | 2.07% | 1.112 |
| 21 | 82.36× | 1.16% | 1.2% | 0.988 |
| 22 | 137.59× | 0.69% | 0.47% | 0.642 |
| 23 | 265.35× | 0.36% | 0.27% | 0.708 |
| 24 | 638.82× | 0.15% | 0.07% | 0.426 |
| 25 | 2,457× | 0.04% | 0% | 0 |
| Road position | Coefficient offered | Survival in the mathematical model | Proportion of attempts getting here | Gross amount per stake unit |
|---|---|---|---|---|
| 1 | 1.18× | 80.93% | 81.67% | 0.964 |
| 2 | 1.46× | 65.41% | 64.67% | 0.944 |
| 3 | 1.83× | 52.19% | 52% | 0.952 |
| 4 | 2.31× | 41.34% | 41.07% | 0.949 |
| 5 | 2.95× | 32.37% | 31.2% | 0.92 |
| 6 | 3.82× | 25% | 23.67% | 0.904 |
| 7 | 5.02× | 19.02% | 17.2% | 0.863 |
| 8 | 6.66× | 14.34% | 13.07% | 0.87 |
| 9 | 9.04× | 10.56% | 9.47% | 0.856 |
| 10 | 12.52× | 7.63% | 6.4% | 0.801 |
| 11 | 17.74× | 5.38% | 4.67% | 0.828 |
| 12 | 25.8× | 3.7% | 3.4% | 0.877 |
| 13 | 38.71× | 2.47% | 1.93% | 0.748 |
| 14 | 60.21× | 1.59% | 1.13% | 0.682 |
| 15 | 97.34× | 0.98% | 0.53% | 0.519 |
| 16 | 166.87× | 0.57% | 0.33% | 0.556 |
| 17 | 305.94× | 0.31% | 0.13% | 0.408 |
| 18 | 595.86× | 0.16% | 0.13% | 0.794 |
| 19 | 1,283.03× | 0.07% | 0.07% | 0.855 |
| 20 | 3,267.64× | 0.03% | 0% | 0 |
| 21 | 10,898.54× | 0.01% | 0% | 0 |
| 22 | 62,162.09× | 0% | 0% | 0 |
| Road position | Coefficient offered | Survival in the mathematical model | Proportion of attempts getting here | Gross amount per stake unit |
|---|---|---|---|---|
| 1 | 1.44× | 66.32% | 67.73% | 0.975 |
| 2 | 2.21× | 43.21% | 43.07% | 0.952 |
| 3 | 3.45× | 27.68% | 28.4% | 0.98 |
| 4 | 5.53× | 17.27% | 18.07% | 0.999 |
| 5 | 9.09× | 10.51% | 10.73% | 0.976 |
| 6 | 15.3× | 6.24% | 6.13% | 0.938 |
| 7 | 26.78× | 3.57% | 3.73% | 1 |
| 8 | 48.7× | 1.96% | 2.27% | 1.104 |
| 9 | 92.54× | 1.03% | 1.13% | 1.049 |
| 10 | 185.08× | 0.52% | 0.6% | 1.11 |
| 11 | 391.25× | 0.24% | 0.33% | 1.304 |
| 12 | 894.28× | 0.11% | 0.13% | 1.192 |
| 13 | 2,235.72× | 0.04% | 0.07% | 1.49 |
| 14 | 6,096.15× | 0.02% | 0% | 0 |
| 15 | 18,960.33× | 0.01% | 0% | 0 |
| 16 | 72,432.75× | 0% | 0% | 0 |
| 17 | 379,632.82× | 0% | 0% | 0 |
| 18 | 3,608,855.25× | 0% | 0% | 0 |
Gross return includes stake. Payout caps apply. No profit forecast.
Limited demo observations. No predictions. Independently unaudited.
Inside the recorded sample
Fixed starting denominator. Pointwise Wilson intervals. No simultaneous curve coverage.
Number of practice attempts: 6,000
Share reaching each successful step
| Game | Difficulty in use | Number of practice attempts | Step one survival | Statistical uncertainty interval | Completed roads | Top multiplier within these attempts |
|---|---|---|---|---|---|---|
| Chicken Road 2 · Easy difficulty | Easy difficulty | 1,500 | 96.2% | 95.11%–97.06% | 55 | 23.24× |
| Chicken Road 2 · Medium difficulty | Medium difficulty | 1,500 | 89.67% | 88.02%–91.11% | 0 | 638.82× |
| Chicken Road 2 · Hard difficulty | Hard difficulty | 1,500 | 81.67% | 79.63%–83.54% | 0 | 1,283.03× |
| Chicken Road 2 · Daredevil difficulty | Daredevil difficulty | 1,500 | 67.73% | 65.32%–70.05% | 0 | 2,235.72× |
Highest successful step, including later losses. No paid prize.
| Road position | Successful rounds | Number of practice attempts | Proportion of attempts getting here | Statistical uncertainty interval |
|---|---|---|---|---|
| 1 | 1,443 | 1,500 | 96.2% | 95.11%–97.06% |
| 2 | 1,409 | 1,500 | 93.93% | 92.61%–95.03% |
| 3 | 1,358 | 1,500 | 90.53% | 88.95%–91.91% |
| 4 | 1,309 | 1,500 | 87.27% | 85.48%–88.86% |
| 5 | 1,247 | 1,500 | 83.13% | 81.15%–84.94% |
| 6 | 1,202 | 1,500 | 80.13% | 78.04%–82.07% |
| 7 | 1,148 | 1,500 | 76.53% | 74.32%–78.61% |
| 8 | 1,103 | 1,500 | 73.53% | 71.24%–75.7% |
| 9 | 1,059 | 1,500 | 70.6% | 68.24%–72.85% |
| 10 | 1,001 | 1,500 | 66.73% | 64.31%–69.07% |
| 11 | 955 | 1,500 | 63.67% | 61.2%–66.06% |
| 12 | 910 | 1,500 | 60.67% | 58.17%–63.11% |
| 13 | 858 | 1,500 | 57.2% | 54.68%–59.68% |
| 14 | 813 | 1,500 | 54.2% | 51.67%–56.71% |
| 15 | 768 | 1,500 | 51.2% | 48.67%–53.72% |
| 16 | 722 | 1,500 | 48.13% | 45.61%–50.66% |
| 17 | 680 | 1,500 | 45.33% | 42.83%–47.86% |
| 18 | 640 | 1,500 | 42.67% | 40.19%–45.19% |
| 19 | 593 | 1,500 | 39.53% | 37.09%–42.03% |
| 20 | 547 | 1,500 | 36.47% | 34.07%–38.93% |
| 21 | 495 | 1,500 | 33% | 30.67%–35.42% |
| 22 | 452 | 1,500 | 30.13% | 27.86%–32.5% |
| 23 | 395 | 1,500 | 26.33% | 24.17%–28.62% |
| 24 | 347 | 1,500 | 23.13% | 21.07%–25.33% |
| 25 | 300 | 1,500 | 20% | 18.05%–22.1% |
| 26 | 245 | 1,500 | 16.33% | 14.55%–18.29% |
| 27 | 196 | 1,500 | 13.07% | 11.45%–14.87% |
| 28 | 152 | 1,500 | 10.13% | 8.71%–11.76% |
| 29 | 107 | 1,500 | 7.13% | 5.94%–8.55% |
| 30 | 55 | 1,500 | 3.67% | 2.83%–4.74% |
| Road position | Successful rounds | Number of practice attempts | Proportion of attempts getting here | Statistical uncertainty interval |
|---|---|---|---|---|
| 1 | 1,345 | 1,500 | 89.67% | 88.02%–91.11% |
| 2 | 1,179 | 1,500 | 78.6% | 76.45%–80.6% |
| 3 | 1,053 | 1,500 | 70.2% | 67.84%–72.46% |
| 4 | 926 | 1,500 | 61.73% | 59.25%–64.16% |
| 5 | 807 | 1,500 | 53.8% | 51.27%–56.31% |
| 6 | 705 | 1,500 | 47% | 44.49%–49.53% |
| 7 | 621 | 1,500 | 41.4% | 38.93%–43.91% |
| 8 | 543 | 1,500 | 36.2% | 33.81%–38.66% |
| 9 | 461 | 1,500 | 30.73% | 28.45%–33.11% |
| 10 | 380 | 1,500 | 25.33% | 23.2%–27.6% |
| 11 | 321 | 1,500 | 21.4% | 19.4%–23.55% |
| 12 | 264 | 1,500 | 17.6% | 15.76%–19.61% |
| 13 | 210 | 1,500 | 14% | 12.34%–15.85% |
| 14 | 172 | 1,500 | 11.47% | 9.95%–13.18% |
| 15 | 134 | 1,500 | 8.93% | 7.59%–10.48% |
| 16 | 94 | 1,500 | 6.27% | 5.15%–7.61% |
| 17 | 76 | 1,500 | 5.07% | 4.07%–6.3% |
| 18 | 54 | 1,500 | 3.6% | 2.77%–4.67% |
| 19 | 42 | 1,500 | 2.8% | 2.08%–3.76% |
| 20 | 31 | 1,500 | 2.07% | 1.46%–2.92% |
| 21 | 18 | 1,500 | 1.2% | 0.76%–1.89% |
| 22 | 7 | 1,500 | 0.47% | 0.23%–0.96% |
| 23 | 4 | 1,500 | 0.27% | 0.1%–0.68% |
| 24 | 1 | 1,500 | 0.07% | 0.01%–0.38% |
| 25 | 0 | 1,500 | 0% | 0%–0.26% |
| Road position | Successful rounds | Number of practice attempts | Proportion of attempts getting here | Statistical uncertainty interval |
|---|---|---|---|---|
| 1 | 1,225 | 1,500 | 81.67% | 79.63%–83.54% |
| 2 | 970 | 1,500 | 64.67% | 62.21%–67.05% |
| 3 | 780 | 1,500 | 52% | 49.47%–54.52% |
| 4 | 616 | 1,500 | 41.07% | 38.6%–43.58% |
| 5 | 468 | 1,500 | 31.2% | 28.91%–33.59% |
| 6 | 355 | 1,500 | 23.67% | 21.58%–25.88% |
| 7 | 258 | 1,500 | 17.2% | 15.37%–19.19% |
| 8 | 196 | 1,500 | 13.07% | 11.45%–14.87% |
| 9 | 142 | 1,500 | 9.47% | 8.09%–11.05% |
| 10 | 96 | 1,500 | 6.4% | 5.27%–7.75% |
| 11 | 70 | 1,500 | 4.67% | 3.71%–5.85% |
| 12 | 51 | 1,500 | 3.4% | 2.6%–4.44% |
| 13 | 29 | 1,500 | 1.93% | 1.35%–2.76% |
| 14 | 17 | 1,500 | 1.13% | 0.71%–1.81% |
| 15 | 8 | 1,500 | 0.53% | 0.27%–1.05% |
| 16 | 5 | 1,500 | 0.33% | 0.14%–0.78% |
| 17 | 2 | 1,500 | 0.13% | 0.04%–0.48% |
| 18 | 2 | 1,500 | 0.13% | 0.04%–0.48% |
| 19 | 1 | 1,500 | 0.07% | 0.01%–0.38% |
| 20 | 0 | 1,500 | 0% | 0%–0.26% |
| 21 | 0 | 1,500 | 0% | 0%–0.26% |
| 22 | 0 | 1,500 | 0% | 0%–0.26% |
| Road position | Successful rounds | Number of practice attempts | Proportion of attempts getting here | Statistical uncertainty interval |
|---|---|---|---|---|
| 1 | 1,016 | 1,500 | 67.73% | 65.32%–70.05% |
| 2 | 646 | 1,500 | 43.07% | 40.58%–45.59% |
| 3 | 426 | 1,500 | 28.4% | 26.18%–30.73% |
| 4 | 271 | 1,500 | 18.07% | 16.2%–20.09% |
| 5 | 161 | 1,500 | 10.73% | 9.27%–12.4% |
| 6 | 92 | 1,500 | 6.13% | 5.03%–7.46% |
| 7 | 56 | 1,500 | 3.73% | 2.89%–4.82% |
| 8 | 34 | 1,500 | 2.27% | 1.63%–3.15% |
| 9 | 17 | 1,500 | 1.13% | 0.71%–1.81% |
| 10 | 9 | 1,500 | 0.6% | 0.32%–1.14% |
| 11 | 5 | 1,500 | 0.33% | 0.14%–0.78% |
| 12 | 2 | 1,500 | 0.13% | 0.04%–0.48% |
| 13 | 1 | 1,500 | 0.07% | 0.01%–0.38% |
| 14 | 0 | 1,500 | 0% | 0%–0.26% |
| 15 | 0 | 1,500 | 0% | 0%–0.26% |
| 16 | 0 | 1,500 | 0% | 0%–0.26% |
| 17 | 0 | 1,500 | 0% | 0%–0.26% |
| 18 | 0 | 1,500 | 0% | 0%–0.26% |
Demo observations. No forecasts. No independent RTP audit.

Developer-stated return: 98% · Maximum game payout: 10,000 USD · Pounds for personal spending plans: GBP (£); the game's provider limits are quoted in USD