Chicken Road 2
Share reaching each successful step
Easy settingMedium settingHard settingDaredevil setting
Chicken Road Wins title 2 of 2 · InOut Games · 2025
This Chicken Road 2 review focuses on InOut’s longer sequel ladders, different stake range and higher payout ceiling.
Chicken Road Wins research team · How the game explanations are checked
Free practice credits. No withdrawals. Adults 18+.
Theoretical return stated by the maker: 95.5% · Game payment ceiling: 20,000 USD
Read the numbers for this gameThe Chicken Road 2 buttons work in familiar ways. The original’s 98% theoretical return exceeds the sequel’s 95.5% over the long run. InOut released the sequel on 15 April 2025. The long-run house edge is 4.5%.
Chicken Road 2 keeps the move-or-collect mechanic but changes the ladders. For the sequel review, easy has 30 steps, Medium 25, Hard 22 and Daredevil 18. These are separate settings from the original's 24, 22, 20 and 15 steps. The sequel's Easy sequence starts at ×1.01 and reaches ×23.24 at its endpoint. Its opening increment is smaller, even though its final Easy multiplier is larger.
The sequel permits stakes of 0.12–200 USD and has a 20,000 USD maximum-win cap. Its RTP is 95.5% per InOut. Keep both published returns visible when comparing the games: 98% for the original and 95.5% for the second. Extra steps and a larger cap describe the available structure. They do not tell you that switching versions will improve your result, or that a particular session will last longer.
In Chicken Road 2, Medium starts at ×1.08 and ends at ×2,457 across 25 steps. Hard begins at ×1.18 and ends at ×62,162.09 across 22 steps. Daredevil begins at ×1.44 and ends at ×3,608,855.25 across 18 steps. Put the mode label beside each comparison. A single maximum multiplier gives a dramatic headline while leaving out the road that leads to it.
The opening figures are useful for understanding what the collect amount would mean after an initial successful step. The farthest coefficients describe the other end of the ladder. Neither end tells you the outcome of a new round. Compare adjacent positions if you want to understand how quickly amounts change, and keep the 20,000 USD cap in view when using the larger coefficients. The game rules remain the place to check how that cap is applied.
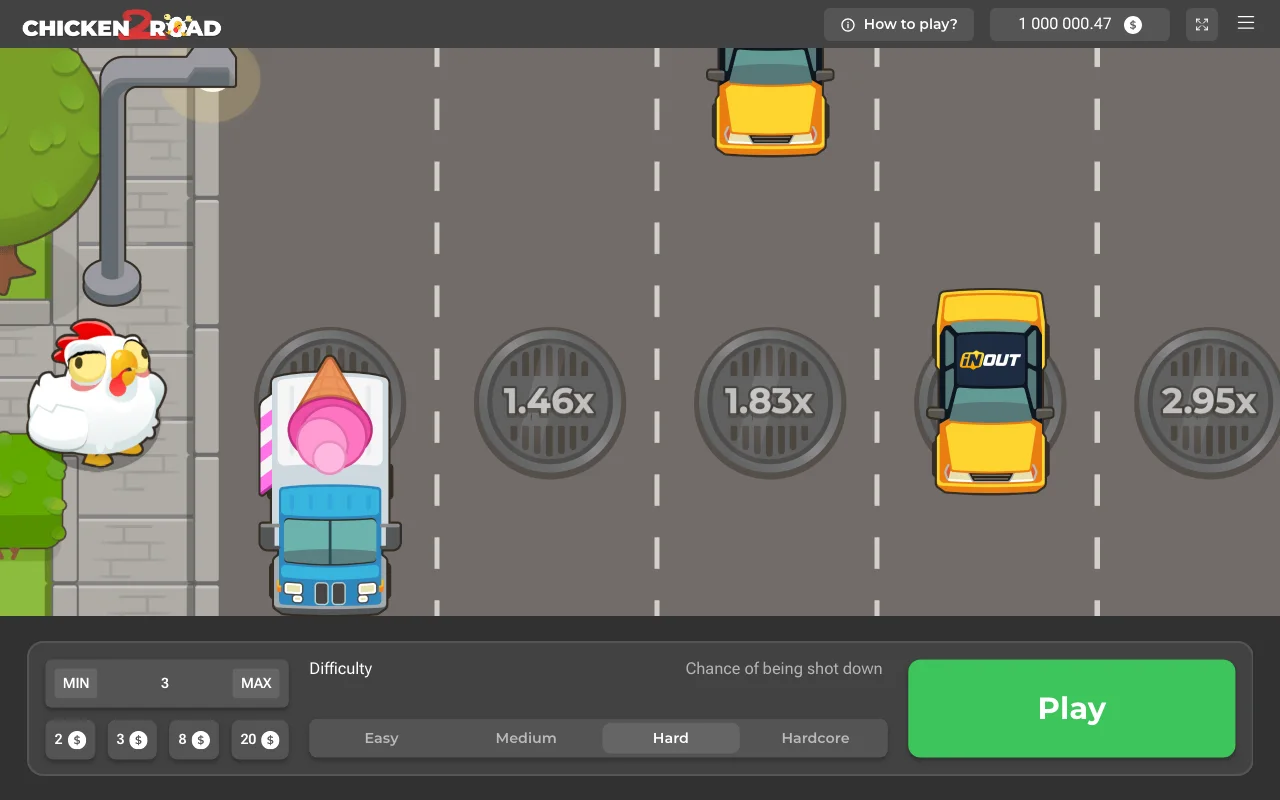
Open the sequel as its own game, then read the selected mode before starting. A familiar screen can hide different numbers. The Easy ladder now contains 30 positions, so scrolling or fitting the whole road on a phone may change which values are easy to see. Keep the current collect amount visible even if you cannot display the entire ladder at once.
Try a demo round focused on collecting, rather than on reaching a particular tile. Then use another round to compare the next difficulty. This keeps your questions small: where is the selector, what changes after a successful move, and how is the completed round shown? Switching versions is simpler when you recognise those controls separately from the artwork. Knowing the interface does not create knowledge of the next random outcome.
The RTP for Chicken Road 2 is 95.5% per InOut. The published percentage describes long-run return; displayed ladders alone do not measure it. You can compare the steps, opening multipliers, stake range and payout cap. Those figures do not tell you the theoretical return across a very large number of rounds.
Do not turn the sequel's bigger endpoint into a substitute return percentage. A higher possible payment can be paired with a lower frequency of reaching it. A short demo run cannot settle that relationship either. When comparing the sequel, place its extra steps, higher stakes and 20,000 USD cap beside its lower 95.5% RTP. Using each game’s own percentage keeps the return comparison accurate without borrowing a figure from another title.
The sequel can pay up to USD 20,000 under its game maximum-win rule. Its most dramatic factor, ×3,608,855.25 at the end of Daredevil, is a ladder value rather than an uncapped payment promise. Read the cap before using a large factor in any gross-return calculation.
Keep the account side separate. A cashier can apply verification, balance and payment conditions, while an active promotion may add stake restrictions. The sequel’s USD 200 game stake ceiling does not override those restrictions. If a calculated amount exceeds the game cap, the farthest multiplication is no longer a useful expectation of payment. Use the actual displayed return and the rules for this edition rather than a figure borrowed from the original or an advert.
The sequel’s demo gives you a way to understand the extra road positions with credits that cannot be withdrawn. Begin with a small practice stake and collect after a surviving crossing. Watch how the completed result differs from the amount that was only possible on the next tile.
Then compare another road while leaving the practice stake unchanged. Medium, Hard and Daredevil use different opening factors, so a changed amount should be read with its mode label. Demo success cannot turn into a mobile payment or establish that the next cash round will survive. Its useful role in this review is to make the longer interface familiar, without requiring a deposit to discover where the collect control is placed.
Chicken Road 2’s Easy road has 30 positions, which may extend beyond the area comfortably shown on a phone. You do not need every distant tile in view to make a present collect decision. Prioritise the stake, selected difficulty and current amount, then expand or adjust the view before starting if those are obscured.
Allow the browser session to load before acting. If the network drops after a crossing, check the round’s settled state through the same account rather than rapidly reopening new sessions. InOut does not supply a standalone Chicken Road app, and an unknown installer is not a necessary repair. For an account amount that remains unclear, contact the operator using its authenticated help route and the round reference where available.
The sequel’s USD 0.12–200 stake range describes a game round, not a cashier transfer. Read the operator’s account currency, conversion, charges and deposit conditions before deciding what that range costs you. No payment method or processing time is universal across every casino offering the title.
Look at the withdrawal route while the choice is still calm. Check whether the payment method can receive funds, what ownership or identity checks apply and which available balance can be withdrawn. Cashing out a surviving chicken does not automatically request a transfer. The operator manages that second action, so use its support channel for transfer questions rather than assuming the animation’s speed says when money should arrive.
For sequel charts, confirm that the block is labelled Chicken Road 2 and read the selected difficulty. A step number on Easy belongs to a different progression from the same number on Daredevil. Next check the dates and included round count, which define the history described by any share or highest result.
An average can change strongly when a high multiplier appears in a limited run. Read the middle result and spread alongside the largest value, and check the axis before comparing bars. A logarithmic scale brings very large values into the same view without making their numerical gaps small. None of those chart shapes tells you whether another crossing will survive or verifies the published theoretical RTP.
The sequel’s random-result system has not been independently audited by Chicken Road Wins. A provably fair description would need usable round inputs, earlier commitments and a published calculation before another person could reproduce a completed result. A provider logo or a long successful road does not perform that check.
Keep round verification separate from the published RTP. Checking a completed outcome means repeating its calculation. RTP tells you about theoretical return over the long run, so it answers a different question. A demo streak cannot answer either by itself. If a casino presents a checking tool, read which exact title it covers and what it asks you to provide. You should not need to hand account credentials to a stranger merely to understand what a fairness claim can demonstrate.
The sequel’s larger stake ceiling and longer roads make it especially useful to read the commitment again before each new round. After switching from another title, check the currency and the selected mode as well as the amount. An earlier losing result has not made a larger next stake more likely to succeed.
Plan a collect choice around what the current amount means to you, while accepting that the round may end before reaching any planned position. A visible later factor remains uncertain. You can also finish reading the ladder without opening another round. A practical habit should make the action clearer, rather than depend on a prediction that a particular sequence of taps will beat a server-side random result.
Adults 18+ only. While exploring the sequel review, set time and spending limits, take breaks and never chase losses.
18+ only. Limit time and spending. Take breaks. Never chase losses.
Inside the recorded sample
Fixed starting denominator. Pointwise Wilson intervals. No simultaneous curve coverage.
Rounds in this demo run: 6,000
Share reaching each successful step
| Game | Selected road | Rounds in this demo run | Step one survival | Range around this proportion | Completed roads | Largest reached coefficient |
|---|---|---|---|---|---|---|
| Chicken Road 2 · Easy setting | Easy setting | 1,500 | 96.2% | 95.11%–97.06% | 55 | 23.24× |
| Chicken Road 2 · Medium setting | Medium setting | 1,500 | 89.67% | 88.02%–91.11% | 0 | 638.82× |
| Chicken Road 2 · Hard setting | Hard setting | 1,500 | 81.67% | 79.63%–83.54% | 0 | 1,283.03× |
| Chicken Road 2 · Daredevil setting | Daredevil setting | 1,500 | 67.73% | 65.32%–70.05% | 0 | 2,235.72× |
Highest successful step, including later losses. No paid prize.
| Position on the road | Successful rounds | Rounds in this demo run | Share of these rounds reaching the position | Range around this proportion |
|---|---|---|---|---|
| 1 | 1,443 | 1,500 | 96.2% | 95.11%–97.06% |
| 2 | 1,409 | 1,500 | 93.93% | 92.61%–95.03% |
| 3 | 1,358 | 1,500 | 90.53% | 88.95%–91.91% |
| 4 | 1,309 | 1,500 | 87.27% | 85.48%–88.86% |
| 5 | 1,247 | 1,500 | 83.13% | 81.15%–84.94% |
| 6 | 1,202 | 1,500 | 80.13% | 78.04%–82.07% |
| 7 | 1,148 | 1,500 | 76.53% | 74.32%–78.61% |
| 8 | 1,103 | 1,500 | 73.53% | 71.24%–75.7% |
| 9 | 1,059 | 1,500 | 70.6% | 68.24%–72.85% |
| 10 | 1,001 | 1,500 | 66.73% | 64.31%–69.07% |
| 11 | 955 | 1,500 | 63.67% | 61.2%–66.06% |
| 12 | 910 | 1,500 | 60.67% | 58.17%–63.11% |
| 13 | 858 | 1,500 | 57.2% | 54.68%–59.68% |
| 14 | 813 | 1,500 | 54.2% | 51.67%–56.71% |
| 15 | 768 | 1,500 | 51.2% | 48.67%–53.72% |
| 16 | 722 | 1,500 | 48.13% | 45.61%–50.66% |
| 17 | 680 | 1,500 | 45.33% | 42.83%–47.86% |
| 18 | 640 | 1,500 | 42.67% | 40.19%–45.19% |
| 19 | 593 | 1,500 | 39.53% | 37.09%–42.03% |
| 20 | 547 | 1,500 | 36.47% | 34.07%–38.93% |
| 21 | 495 | 1,500 | 33% | 30.67%–35.42% |
| 22 | 452 | 1,500 | 30.13% | 27.86%–32.5% |
| 23 | 395 | 1,500 | 26.33% | 24.17%–28.62% |
| 24 | 347 | 1,500 | 23.13% | 21.07%–25.33% |
| 25 | 300 | 1,500 | 20% | 18.05%–22.1% |
| 26 | 245 | 1,500 | 16.33% | 14.55%–18.29% |
| 27 | 196 | 1,500 | 13.07% | 11.45%–14.87% |
| 28 | 152 | 1,500 | 10.13% | 8.71%–11.76% |
| 29 | 107 | 1,500 | 7.13% | 5.94%–8.55% |
| 30 | 55 | 1,500 | 3.67% | 2.83%–4.74% |
| Position on the road | Successful rounds | Rounds in this demo run | Share of these rounds reaching the position | Range around this proportion |
|---|---|---|---|---|
| 1 | 1,345 | 1,500 | 89.67% | 88.02%–91.11% |
| 2 | 1,179 | 1,500 | 78.6% | 76.45%–80.6% |
| 3 | 1,053 | 1,500 | 70.2% | 67.84%–72.46% |
| 4 | 926 | 1,500 | 61.73% | 59.25%–64.16% |
| 5 | 807 | 1,500 | 53.8% | 51.27%–56.31% |
| 6 | 705 | 1,500 | 47% | 44.49%–49.53% |
| 7 | 621 | 1,500 | 41.4% | 38.93%–43.91% |
| 8 | 543 | 1,500 | 36.2% | 33.81%–38.66% |
| 9 | 461 | 1,500 | 30.73% | 28.45%–33.11% |
| 10 | 380 | 1,500 | 25.33% | 23.2%–27.6% |
| 11 | 321 | 1,500 | 21.4% | 19.4%–23.55% |
| 12 | 264 | 1,500 | 17.6% | 15.76%–19.61% |
| 13 | 210 | 1,500 | 14% | 12.34%–15.85% |
| 14 | 172 | 1,500 | 11.47% | 9.95%–13.18% |
| 15 | 134 | 1,500 | 8.93% | 7.59%–10.48% |
| 16 | 94 | 1,500 | 6.27% | 5.15%–7.61% |
| 17 | 76 | 1,500 | 5.07% | 4.07%–6.3% |
| 18 | 54 | 1,500 | 3.6% | 2.77%–4.67% |
| 19 | 42 | 1,500 | 2.8% | 2.08%–3.76% |
| 20 | 31 | 1,500 | 2.07% | 1.46%–2.92% |
| 21 | 18 | 1,500 | 1.2% | 0.76%–1.89% |
| 22 | 7 | 1,500 | 0.47% | 0.23%–0.96% |
| 23 | 4 | 1,500 | 0.27% | 0.1%–0.68% |
| 24 | 1 | 1,500 | 0.07% | 0.01%–0.38% |
| 25 | 0 | 1,500 | 0% | 0%–0.26% |
| Position on the road | Successful rounds | Rounds in this demo run | Share of these rounds reaching the position | Range around this proportion |
|---|---|---|---|---|
| 1 | 1,225 | 1,500 | 81.67% | 79.63%–83.54% |
| 2 | 970 | 1,500 | 64.67% | 62.21%–67.05% |
| 3 | 780 | 1,500 | 52% | 49.47%–54.52% |
| 4 | 616 | 1,500 | 41.07% | 38.6%–43.58% |
| 5 | 468 | 1,500 | 31.2% | 28.91%–33.59% |
| 6 | 355 | 1,500 | 23.67% | 21.58%–25.88% |
| 7 | 258 | 1,500 | 17.2% | 15.37%–19.19% |
| 8 | 196 | 1,500 | 13.07% | 11.45%–14.87% |
| 9 | 142 | 1,500 | 9.47% | 8.09%–11.05% |
| 10 | 96 | 1,500 | 6.4% | 5.27%–7.75% |
| 11 | 70 | 1,500 | 4.67% | 3.71%–5.85% |
| 12 | 51 | 1,500 | 3.4% | 2.6%–4.44% |
| 13 | 29 | 1,500 | 1.93% | 1.35%–2.76% |
| 14 | 17 | 1,500 | 1.13% | 0.71%–1.81% |
| 15 | 8 | 1,500 | 0.53% | 0.27%–1.05% |
| 16 | 5 | 1,500 | 0.33% | 0.14%–0.78% |
| 17 | 2 | 1,500 | 0.13% | 0.04%–0.48% |
| 18 | 2 | 1,500 | 0.13% | 0.04%–0.48% |
| 19 | 1 | 1,500 | 0.07% | 0.01%–0.38% |
| 20 | 0 | 1,500 | 0% | 0%–0.26% |
| 21 | 0 | 1,500 | 0% | 0%–0.26% |
| 22 | 0 | 1,500 | 0% | 0%–0.26% |
| Position on the road | Successful rounds | Rounds in this demo run | Share of these rounds reaching the position | Range around this proportion |
|---|---|---|---|---|
| 1 | 1,016 | 1,500 | 67.73% | 65.32%–70.05% |
| 2 | 646 | 1,500 | 43.07% | 40.58%–45.59% |
| 3 | 426 | 1,500 | 28.4% | 26.18%–30.73% |
| 4 | 271 | 1,500 | 18.07% | 16.2%–20.09% |
| 5 | 161 | 1,500 | 10.73% | 9.27%–12.4% |
| 6 | 92 | 1,500 | 6.13% | 5.03%–7.46% |
| 7 | 56 | 1,500 | 3.73% | 2.89%–4.82% |
| 8 | 34 | 1,500 | 2.27% | 1.63%–3.15% |
| 9 | 17 | 1,500 | 1.13% | 0.71%–1.81% |
| 10 | 9 | 1,500 | 0.6% | 0.32%–1.14% |
| 11 | 5 | 1,500 | 0.33% | 0.14%–0.78% |
| 12 | 2 | 1,500 | 0.13% | 0.04%–0.48% |
| 13 | 1 | 1,500 | 0.07% | 0.01%–0.38% |
| 14 | 0 | 1,500 | 0% | 0%–0.26% |
| 15 | 0 | 1,500 | 0% | 0%–0.26% |
| 16 | 0 | 1,500 | 0% | 0%–0.26% |
| 17 | 0 | 1,500 | 0% | 0%–0.26% |
| 18 | 0 | 1,500 | 0% | 0%–0.26% |
Demo observations. No forecasts. No independent RTP audit.

Theoretical return stated by the maker: 98% · Game payment ceiling: 10,000 USD
Chicken Road 2 is InOut’s second step-game title, with 30/25/22/18 steps across its four modes. Bets range from 0.12–200 USD, with a 20,000 USD cap.
It describes a theoretical long-run return, not a refund or a target for a short session.
No. The step coefficient and maximum-win ceiling are separate game figures; the rules explain how the ceiling limits a reached return.
No. The sequel demo balance is practice-only, has no cash value and is not linked to a real-money account; use it to learn the controls.
Cash-out ends the current round at the available return; withdrawing casino funds is a separate cashier request.
The casino's cashier handles withdrawals. For a missing payment, send the transaction reference to support and do not disclose credentials to a search result.
Outcome generation: independently unverified by us.
Check algorithm, commitments, seeds and nonce.
| Position on the road | Coefficient for this position | Survival under the stated model | Share of these rounds reaching the position | Gross return for each unit put at risk |
|---|---|---|---|---|
| 1 | 1.01× | 94.55% | 96.2% | 0.972 |
| 2 | 1.03× | 92.72% | 93.93% | 0.968 |
| 3 | 1.06× | 90.09% | 90.53% | 0.96 |
| 4 | 1.1× | 86.82% | 87.27% | 0.96 |
| 5 | 1.15× | 83.04% | 83.13% | 0.956 |
| 6 | 1.19× | 80.25% | 80.13% | 0.954 |
| 7 | 1.24× | 77.02% | 76.53% | 0.949 |
| 8 | 1.3× | 73.46% | 73.53% | 0.956 |
| 9 | 1.35× | 70.74% | 70.6% | 0.953 |
| 10 | 1.42× | 67.25% | 66.73% | 0.948 |
| 11 | 1.48× | 64.53% | 63.67% | 0.942 |
| 12 | 1.56× | 61.22% | 60.67% | 0.946 |
| 13 | 1.65× | 57.88% | 57.2% | 0.944 |
| 14 | 1.75× | 54.57% | 54.2% | 0.949 |
| 15 | 1.85× | 51.62% | 51.2% | 0.947 |
| 16 | 1.98× | 48.23% | 48.13% | 0.953 |
| 17 | 2.12× | 45.05% | 45.33% | 0.961 |
| 18 | 2.28× | 41.89% | 42.67% | 0.973 |
| 19 | 2.47× | 38.66% | 39.53% | 0.976 |
| 20 | 2.7× | 35.37% | 36.47% | 0.985 |
| 21 | 2.96× | 32.26% | 33% | 0.977 |
| 22 | 3.28× | 29.12% | 30.13% | 0.988 |
| 23 | 3.7× | 25.81% | 26.33% | 0.974 |
| 24 | 4.11× | 23.24% | 23.13% | 0.951 |
| 25 | 4.64× | 20.58% | 20% | 0.928 |
| 26 | 5.39× | 17.72% | 16.33% | 0.88 |
| 27 | 6.5× | 14.69% | 13.07% | 0.849 |
| 28 | 8.36× | 11.42% | 10.13% | 0.847 |
| 29 | 12.08× | 7.91% | 7.13% | 0.862 |
| 30 | 23.24× | 4.11% | 3.67% | 0.852 |
| Position on the road | Coefficient for this position | Survival under the stated model | Share of these rounds reaching the position | Gross return for each unit put at risk |
|---|---|---|---|---|
| 1 | 1.08× | 88.43% | 89.67% | 0.968 |
| 2 | 1.21× | 78.93% | 78.6% | 0.951 |
| 3 | 1.37× | 69.71% | 70.2% | 0.962 |
| 4 | 1.56× | 61.22% | 61.73% | 0.963 |
| 5 | 1.78× | 53.65% | 53.8% | 0.958 |
| 6 | 2.05× | 46.59% | 47% | 0.963 |
| 7 | 2.37× | 40.3% | 41.4% | 0.981 |
| 8 | 2.77× | 34.48% | 36.2% | 1.003 |
| 9 | 3.24× | 29.48% | 30.73% | 0.996 |
| 10 | 3.85× | 24.81% | 25.33% | 0.975 |
| 11 | 4.62× | 20.67% | 21.4% | 0.989 |
| 12 | 5.61× | 17.02% | 17.6% | 0.987 |
| 13 | 6.91× | 13.82% | 14% | 0.967 |
| 14 | 8.64× | 11.05% | 11.47% | 0.991 |
| 15 | 10.99× | 8.69% | 8.93% | 0.982 |
| 16 | 14.29× | 6.68% | 6.27% | 0.896 |
| 17 | 18.96× | 5.04% | 5.07% | 0.961 |
| 18 | 26.07× | 3.66% | 3.6% | 0.939 |
| 19 | 37.24× | 2.56% | 2.8% | 1.043 |
| 20 | 53.82× | 1.77% | 2.07% | 1.112 |
| 21 | 82.36× | 1.16% | 1.2% | 0.988 |
| 22 | 137.59× | 0.69% | 0.47% | 0.642 |
| 23 | 265.35× | 0.36% | 0.27% | 0.708 |
| 24 | 638.82× | 0.15% | 0.07% | 0.426 |
| 25 | 2,457× | 0.04% | 0% | 0 |
| Position on the road | Coefficient for this position | Survival under the stated model | Share of these rounds reaching the position | Gross return for each unit put at risk |
|---|---|---|---|---|
| 1 | 1.18× | 80.93% | 81.67% | 0.964 |
| 2 | 1.46× | 65.41% | 64.67% | 0.944 |
| 3 | 1.83× | 52.19% | 52% | 0.952 |
| 4 | 2.31× | 41.34% | 41.07% | 0.949 |
| 5 | 2.95× | 32.37% | 31.2% | 0.92 |
| 6 | 3.82× | 25% | 23.67% | 0.904 |
| 7 | 5.02× | 19.02% | 17.2% | 0.863 |
| 8 | 6.66× | 14.34% | 13.07% | 0.87 |
| 9 | 9.04× | 10.56% | 9.47% | 0.856 |
| 10 | 12.52× | 7.63% | 6.4% | 0.801 |
| 11 | 17.74× | 5.38% | 4.67% | 0.828 |
| 12 | 25.8× | 3.7% | 3.4% | 0.877 |
| 13 | 38.71× | 2.47% | 1.93% | 0.748 |
| 14 | 60.21× | 1.59% | 1.13% | 0.682 |
| 15 | 97.34× | 0.98% | 0.53% | 0.519 |
| 16 | 166.87× | 0.57% | 0.33% | 0.556 |
| 17 | 305.94× | 0.31% | 0.13% | 0.408 |
| 18 | 595.86× | 0.16% | 0.13% | 0.794 |
| 19 | 1,283.03× | 0.07% | 0.07% | 0.855 |
| 20 | 3,267.64× | 0.03% | 0% | 0 |
| 21 | 10,898.54× | 0.01% | 0% | 0 |
| 22 | 62,162.09× | 0% | 0% | 0 |
| Position on the road | Coefficient for this position | Survival under the stated model | Share of these rounds reaching the position | Gross return for each unit put at risk |
|---|---|---|---|---|
| 1 | 1.44× | 66.32% | 67.73% | 0.975 |
| 2 | 2.21× | 43.21% | 43.07% | 0.952 |
| 3 | 3.45× | 27.68% | 28.4% | 0.98 |
| 4 | 5.53× | 17.27% | 18.07% | 0.999 |
| 5 | 9.09× | 10.51% | 10.73% | 0.976 |
| 6 | 15.3× | 6.24% | 6.13% | 0.938 |
| 7 | 26.78× | 3.57% | 3.73% | 1 |
| 8 | 48.7× | 1.96% | 2.27% | 1.104 |
| 9 | 92.54× | 1.03% | 1.13% | 1.049 |
| 10 | 185.08× | 0.52% | 0.6% | 1.11 |
| 11 | 391.25× | 0.24% | 0.33% | 1.304 |
| 12 | 894.28× | 0.11% | 0.13% | 1.192 |
| 13 | 2,235.72× | 0.04% | 0.07% | 1.49 |
| 14 | 6,096.15× | 0.02% | 0% | 0 |
| 15 | 18,960.33× | 0.01% | 0% | 0 |
| 16 | 72,432.75× | 0% | 0% | 0 |
| 17 | 379,632.82× | 0% | 0% | 0 |
| 18 | 3,608,855.25× | 0% | 0% | 0 |
Gross return includes stake. Payout caps apply. No profit forecast.
Limited demo observations. No predictions. Independently unaudited.
Model: RTP ÷ multiplier. Independently unverified.
| Position on the road | Share of these rounds reaching the position | Range around this proportion | Survival under the stated model |
|---|---|---|---|
| 1 | 96.2% | 95.11% – 97.06% | 94.55% |
| 2 | 93.93% | 92.61% – 95.03% | 92.72% |
| 3 | 90.53% | 88.95% – 91.91% | 90.09% |
| 4 | 87.27% | 85.48% – 88.86% | 86.82% |
| 5 | 83.13% | 81.15% – 84.94% | 83.04% |
| 6 | 80.13% | 78.04% – 82.07% | 80.25% |
| 7 | 76.53% | 74.32% – 78.61% | 77.02% |
| 8 | 73.53% | 71.24% – 75.7% | 73.46% |
| 9 | 70.6% | 68.24% – 72.85% | 70.74% |
| 10 | 66.73% | 64.31% – 69.07% | 67.25% |
| 11 | 63.67% | 61.2% – 66.06% | 64.53% |
| 12 | 60.67% | 58.17% – 63.11% | 61.22% |
| 13 | 57.2% | 54.68% – 59.68% | 57.88% |
| 14 | 54.2% | 51.67% – 56.71% | 54.57% |
| 15 | 51.2% | 48.67% – 53.72% | 51.62% |
| 16 | 48.13% | 45.61% – 50.66% | 48.23% |
| 17 | 45.33% | 42.83% – 47.86% | 45.05% |
| 18 | 42.67% | 40.19% – 45.19% | 41.89% |
| 19 | 39.53% | 37.09% – 42.03% | 38.66% |
| 20 | 36.47% | 34.07% – 38.93% | 35.37% |
| 21 | 33% | 30.67% – 35.42% | 32.26% |
| 22 | 30.13% | 27.86% – 32.5% | 29.12% |
| 23 | 26.33% | 24.17% – 28.62% | 25.81% |
| 24 | 23.13% | 21.07% – 25.33% | 23.24% |
| 25 | 20% | 18.05% – 22.1% | 20.58% |
| 26 | 16.33% | 14.55% – 18.29% | 17.72% |
| 27 | 13.07% | 11.45% – 14.87% | 14.69% |
| 28 | 10.13% | 8.71% – 11.76% | 11.42% |
| 29 | 7.13% | 5.94% – 8.55% | 7.91% |
| 30 | 3.67% | 2.83% – 4.74% | 4.11% |
| Position on the road | Share of these rounds reaching the position | Range around this proportion | Survival under the stated model |
|---|---|---|---|
| 1 | 89.67% | 88.02% – 91.11% | 88.43% |
| 2 | 78.6% | 76.45% – 80.6% | 78.93% |
| 3 | 70.2% | 67.84% – 72.46% | 69.71% |
| 4 | 61.73% | 59.25% – 64.16% | 61.22% |
| 5 | 53.8% | 51.27% – 56.31% | 53.65% |
| 6 | 47% | 44.49% – 49.53% | 46.59% |
| 7 | 41.4% | 38.93% – 43.91% | 40.3% |
| 8 | 36.2% | 33.81% – 38.66% | 34.48% |
| 9 | 30.73% | 28.45% – 33.11% | 29.48% |
| 10 | 25.33% | 23.2% – 27.6% | 24.81% |
| 11 | 21.4% | 19.4% – 23.55% | 20.67% |
| 12 | 17.6% | 15.76% – 19.61% | 17.02% |
| 13 | 14% | 12.34% – 15.85% | 13.82% |
| 14 | 11.47% | 9.95% – 13.18% | 11.05% |
| 15 | 8.93% | 7.59% – 10.48% | 8.69% |
| 16 | 6.27% | 5.15% – 7.61% | 6.68% |
| 17 | 5.07% | 4.07% – 6.3% | 5.04% |
| 18 | 3.6% | 2.77% – 4.67% | 3.66% |
| 19 | 2.8% | 2.08% – 3.76% | 2.56% |
| 20 | 2.07% | 1.46% – 2.92% | 1.77% |
| 21 | 1.2% | 0.76% – 1.89% | 1.16% |
| 22 | 0.47% | 0.23% – 0.96% | 0.69% |
| 23 | 0.27% | 0.1% – 0.68% | 0.36% |
| 24 | 0.07% | 0.01% – 0.38% | 0.15% |
| 25 | 0% | 0% – 0.26% | 0.04% |
| Position on the road | Share of these rounds reaching the position | Range around this proportion | Survival under the stated model |
|---|---|---|---|
| 1 | 81.67% | 79.63% – 83.54% | 80.93% |
| 2 | 64.67% | 62.21% – 67.05% | 65.41% |
| 3 | 52% | 49.47% – 54.52% | 52.19% |
| 4 | 41.07% | 38.6% – 43.58% | 41.34% |
| 5 | 31.2% | 28.91% – 33.59% | 32.37% |
| 6 | 23.67% | 21.58% – 25.88% | 25% |
| 7 | 17.2% | 15.37% – 19.19% | 19.02% |
| 8 | 13.07% | 11.45% – 14.87% | 14.34% |
| 9 | 9.47% | 8.09% – 11.05% | 10.56% |
| 10 | 6.4% | 5.27% – 7.75% | 7.63% |
| 11 | 4.67% | 3.71% – 5.85% | 5.38% |
| 12 | 3.4% | 2.6% – 4.44% | 3.7% |
| 13 | 1.93% | 1.35% – 2.76% | 2.47% |
| 14 | 1.13% | 0.71% – 1.81% | 1.59% |
| 15 | 0.53% | 0.27% – 1.05% | 0.98% |
| 16 | 0.33% | 0.14% – 0.78% | 0.57% |
| 17 | 0.13% | 0.04% – 0.48% | 0.31% |
| 18 | 0.13% | 0.04% – 0.48% | 0.16% |
| 19 | 0.07% | 0.01% – 0.38% | 0.07% |
| 20 | 0% | 0% – 0.26% | 0.03% |
| 21 | 0% | 0% – 0.26% | 0.01% |
| 22 | 0% | 0% – 0.26% | 0% |
| Position on the road | Share of these rounds reaching the position | Range around this proportion | Survival under the stated model |
|---|---|---|---|
| 1 | 67.73% | 65.32% – 70.05% | 66.32% |
| 2 | 43.07% | 40.58% – 45.59% | 43.21% |
| 3 | 28.4% | 26.18% – 30.73% | 27.68% |
| 4 | 18.07% | 16.2% – 20.09% | 17.27% |
| 5 | 10.73% | 9.27% – 12.4% | 10.51% |
| 6 | 6.13% | 5.03% – 7.46% | 6.24% |
| 7 | 3.73% | 2.89% – 4.82% | 3.57% |
| 8 | 2.27% | 1.63% – 3.15% | 1.96% |
| 9 | 1.13% | 0.71% – 1.81% | 1.03% |
| 10 | 0.6% | 0.32% – 1.14% | 0.52% |
| 11 | 0.33% | 0.14% – 0.78% | 0.24% |
| 12 | 0.13% | 0.04% – 0.48% | 0.11% |
| 13 | 0.07% | 0.01% – 0.38% | 0.04% |
| 14 | 0% | 0% – 0.26% | 0.02% |
| 15 | 0% | 0% – 0.26% | 0.01% |
| 16 | 0% | 0% – 0.26% | 0% |
| 17 | 0% | 0% – 0.26% | 0% |
| 18 | 0% | 0% – 0.26% | 0% |
Chicken Road 2