Chicken Road
Share reaching each successful step
Easy settingMedium settingHard settingDaredevil setting

Chicken Road Wins title 1 of 2 · InOut Games · 2024
This Chicken Road review examines InOut’s original crossing game: the stake committed to each round, the four ladders and the amount available to collect.
Chicken Road Wins research team · How the game explanations are checked

Free practice credits. No withdrawals. Adults 18+.
Theoretical return stated by the maker: 98% · Game payment ceiling: 10,000 USD
Read the numbers for this gameThe Chicken Road game review keeps the payout cap beside the largest listed factors.
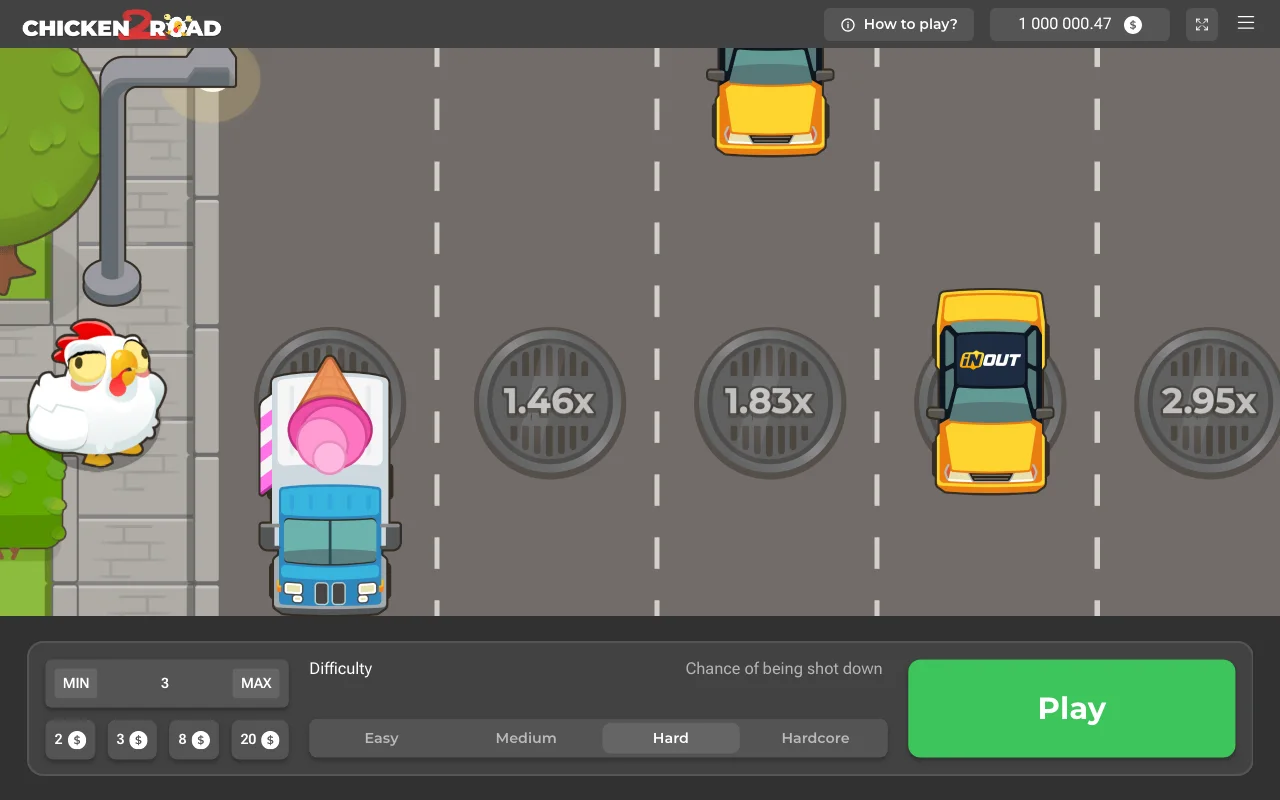
The original Chicken Road builds each round around a stake and a series of attempted crossings. After a success, the available collect amount rises. You can accept that amount or attempt another hazard. A collision can lose the full stake, so continuing is a new decision about an active round rather than progress towards an amount you are already owed.
That simple format is the reason to look closely at the controls in this Chicken Road game review. The chicken gives a visible account of movement, while the money fields show the commitment and possible return. Neither tap speed nor a quiet-looking patch of road reveals the random outcome. Begin by distinguishing what you choose from what remains uncertain after the choice.
The original Easy road has 24 steps. Its opening multiplier is ×1.03, followed by ×1.07 and ×1.12; the endpoint is ×19.44. Read the beginning as well as the finish. The initial increase is small, and continuing puts the whole round at risk again. The name Easy describes this road setting. It does not turn the first move into a certainty or make a sequence of successful moves inevitable.
Use Easy in the demo to see how the current collect figure changes. Try collecting at a reached position and then start a separate round to explore another part of the ladder. The resulting screen states are more useful than a plan to reach the end every time. When comparing modes, hold the demo stake steady so a difference in the displayed amount comes from the multiplier rather than from changing the stake too.
Medium in Chicken Road has 22 steps, starting at ×1.12 and ending at ×1,788.80. Early values include ×1.28, ×1.47 and ×1.70. Those neighbouring figures show the shape of the increase more clearly than the endpoint alone. Later values climb much more sharply, but every later position depends on surviving the earlier moves. A screen full of large multipliers does not describe how frequently you will reach them.
Compare a reached multiplier with the next available step before making another choice. Once you continue, the amount you could have collected is exposed to the next result. It is helpful to say that choice plainly: keep the current return, or risk the round for a different return. Neither the mode name nor a previous successful round answers it for you. Medium is another ladder to understand, rather than an upgrade that you must unlock through practice.
Hard uses 20 steps in the original. It begins at ×1.23, with ×1.55 and ×1.98 next, and the final coefficient is ×41,321.43. Fewer steps do not mean a shorter certain route to a payout. The larger numbers are attached to a different road, and a failed move still removes the stake. Compare the opening positions before allowing the largest figure to dominate your choice.
Some searches call the game hardcore. The four difficulty labels here are Easy, Medium, Hard and Daredevil; read the actual selector rather than treating a search phrase as another mode. If a casino uses different labels, check the game rules and provider name before applying these numbers. A similar-looking chicken title can have its own settings. Match the title first, then the difficulty, then the multiplier at the position you are reading.
Daredevil has 15 steps in the first game. The opening multipliers are ×1.63, ×2.80 and ×4.95, while the last coefficient is ×2,542,251.93. The jump from those early values to the endpoint is enormous. It makes the final tile striking to look at, but the tile is neither a prediction nor a typical outcome. InOut's 10,000 USD maximum-win ceiling for this game must be read alongside its multiplier ladder.
A coefficient and a payout cap do separate jobs. The coefficient helps calculate the return attached to a reached step; the cap limits what the game can pay. If you multiply a large stake by the final multiplier, compare the result with the cap before treating it as a possible payout. Before comparing the modes by their biggest numbers, read the cap and the rules for your exact game. The shortest road is still a gambling setting whose result you cannot steer.
The original's permitted stake range is 0.01–150 USD. Chicken Road 2 uses 0.12–200 USD. These provider figures concern an individual round, rather than a casino's minimum deposit or withdrawal requirement. A casino can display an account balance in another currency; read the actual conversion and stake values there instead of treating a dollar number as a local amount.
A multiplier has no currency of its own. Apply it to the round stake to calculate gross return, then subtract that stake to calculate the difference before any other conditions. Keep the payout ceiling in the calculation as well. Raising the stake changes both the possible return and the amount you can lose. It does not change a multiplier into a more favourable chance. Choose an amount you can understand without mentally translating a deposit total during the round.
The original’s maximum win is USD 10,000. Put that figure next to the last Daredevil factor rather than reading either alone. The ladder can list a multiplication far larger than the amount payable. A maximum win limits the game return; it is not an amount a session gradually becomes entitled to receive.
When calculating a possible result, check the stake, reached factor and cap for the same edition. Do not use the sequel’s USD 20,000 ceiling because its screen looks similar. The casino also sets rules for withdrawing your available balance; read those separately from the game’s payout cap. Those belong to its terms, so the original game ceiling cannot answer questions about transfer timing, verification or the method used to move money out.
For original Chicken Road, InOut states RTP of 98%. Its mathematical complement is a 2% theoretical house edge over long-run turnover. Turnover adds every stake, including money collected and used in another round. It is therefore different from the amount first deposited, and RTP is not a promised refund on that deposit.
A short session can move the balance sharply in either direction. Collecting a surviving round fixes that round’s ending without making future wagering immune to the house edge. Keep the percentage attached to this original review: Chicken Road 2 RTP is 95.5% per InOut. Its similar controls do not justify copying the original number into the sequel, and a limited run of demo outcomes cannot supply a theoretical percentage.
On the original screen, locate the round stake, mode selector, current factor and collect control before starting. Use demo to make the first collect action familiar. After a surviving crossing, compare the amount offered with the original stake and read what the completed balance shows when you accept it.
Change the mode only after the previous round is finished, then check the stake again. A newly selected road attracts attention, but another field can still carry an earlier value. On a phone, dismiss any keyboard or overlay hiding the amount. Knowing the published ladder is useful only when you can also read the actual commitment and the control you are about to press.
You can approach original Chicken Road through a supported mobile browser lobby. Check the InOut Games name and original title inside the information panel, particularly if a link led through several similarly named products. InOut does not provide a standalone Chicken Road app, and another publisher’s phone icon does not identify this game.
Make the stake and collect amount visible at the same time. A large chicken animation is less useful than readable money fields. If play freezes, return to the same account and check the settled round before starting again. A refresh reconnects the view; it does not cancel a completed result. Persistent balance questions belong with the casino through its own support route, without sharing credentials with a private contact.
InOut supplies the original game, but the casino controls your player account. That business handles identity checks, deposits, withdrawals and complaints. Chicken Road Wins can explain the crossing choices without accessing a balance or altering a settled outcome. Direct a question to the party responsible for the action concerned.
Before paying, find the company running the casino, what its licence covers and whether it accepts players from your country. Check local law and the regulator relevant to your location as well. Then read the actual cashier currency, charges and withdrawal conditions for your account. A familiar lobby title does not answer those questions. The original’s USD 10,000 game cap also tells you nothing about the operator’s rules for withdrawing your balance.
Adults 18+ only. While exploring the original game review, set time and spending limits, take breaks and never chase losses.
Inside the recorded sample
Fixed starting denominator. Pointwise Wilson intervals. No simultaneous curve coverage.
Rounds in this demo run: 6,000
Share reaching each successful step
| Game | Selected road | Rounds in this demo run | Step one survival | Range around this proportion | Completed roads | Largest reached coefficient |
|---|---|---|---|---|---|---|
| Chicken Road · Easy setting | Easy setting | 1,500 | 95.47% | 94.29%–96.41% | 73 | 19.44× |
| Chicken Road · Medium setting | Medium setting | 1,500 | 87.8% | 86.05%–89.36% | 1 | 1,788.8× |
| Chicken Road · Hard setting | Hard setting | 1,500 | 81.67% | 79.63%–83.54% | 0 | 2,007.63× |
| Chicken Road · Daredevil setting | Daredevil setting | 1,500 | 59.4% | 56.89%–61.86% | 0 | 890.19× |
Highest successful step, including later losses. No paid prize.
| Position on the road | Successful rounds | Rounds in this demo run | Share of these rounds reaching the position | Range around this proportion |
|---|---|---|---|---|
| 1 | 1,432 | 1,500 | 95.47% | 94.29%–96.41% |
| 2 | 1,367 | 1,500 | 91.13% | 89.59%–92.47% |
| 3 | 1,316 | 1,500 | 87.73% | 85.98%–89.3% |
| 4 | 1,246 | 1,500 | 83.07% | 81.08%–84.88% |
| 5 | 1,176 | 1,500 | 78.4% | 76.25%–80.41% |
| 6 | 1,112 | 1,500 | 74.13% | 71.86%–76.29% |
| 7 | 1,054 | 1,500 | 70.27% | 67.9%–72.53% |
| 8 | 1,000 | 1,500 | 66.67% | 64.24%–69.01% |
| 9 | 937 | 1,500 | 62.47% | 59.99%–64.88% |
| 10 | 860 | 1,500 | 57.33% | 54.81%–59.81% |
| 11 | 813 | 1,500 | 54.2% | 51.67%–56.71% |
| 12 | 766 | 1,500 | 51.07% | 48.54%–53.59% |
| 13 | 706 | 1,500 | 47.07% | 44.55%–49.6% |
| 14 | 649 | 1,500 | 43.27% | 40.78%–45.79% |
| 15 | 595 | 1,500 | 39.67% | 37.22%–42.17% |
| 16 | 538 | 1,500 | 35.87% | 33.48%–38.33% |
| 17 | 494 | 1,500 | 32.93% | 30.6%–35.35% |
| 18 | 433 | 1,500 | 28.87% | 26.63%–31.21% |
| 19 | 369 | 1,500 | 24.6% | 22.49%–26.84% |
| 20 | 315 | 1,500 | 21% | 19.01%–23.13% |
| 21 | 242 | 1,500 | 16.13% | 14.36%–18.08% |
| 22 | 190 | 1,500 | 12.67% | 11.08%–14.45% |
| 23 | 135 | 1,500 | 9% | 7.65%–10.55% |
| 24 | 73 | 1,500 | 4.87% | 3.89%–6.08% |
| Position on the road | Successful rounds | Rounds in this demo run | Share of these rounds reaching the position | Range around this proportion |
|---|---|---|---|---|
| 1 | 1,317 | 1,500 | 87.8% | 86.05%–89.36% |
| 2 | 1,159 | 1,500 | 77.27% | 75.08%–79.32% |
| 3 | 1,002 | 1,500 | 66.8% | 64.38%–69.14% |
| 4 | 857 | 1,500 | 57.13% | 54.61%–59.62% |
| 5 | 728 | 1,500 | 48.53% | 46.01%–51.06% |
| 6 | 615 | 1,500 | 41% | 38.54%–43.51% |
| 7 | 519 | 1,500 | 34.6% | 32.23%–37.04% |
| 8 | 426 | 1,500 | 28.4% | 26.18%–30.73% |
| 9 | 342 | 1,500 | 22.8% | 20.75%–24.99% |
| 10 | 266 | 1,500 | 17.73% | 15.88%–19.75% |
| 11 | 209 | 1,500 | 13.93% | 12.27%–15.78% |
| 12 | 164 | 1,500 | 10.93% | 9.45%–12.61% |
| 13 | 132 | 1,500 | 8.8% | 7.47%–10.34% |
| 14 | 97 | 1,500 | 6.47% | 5.33%–7.83% |
| 15 | 66 | 1,500 | 4.4% | 3.47%–5.56% |
| 16 | 52 | 1,500 | 3.47% | 2.65%–4.52% |
| 17 | 35 | 1,500 | 2.33% | 1.68%–3.23% |
| 18 | 25 | 1,500 | 1.67% | 1.13%–2.45% |
| 19 | 12 | 1,500 | 0.8% | 0.46%–1.39% |
| 20 | 8 | 1,500 | 0.53% | 0.27%–1.05% |
| 21 | 3 | 1,500 | 0.2% | 0.07%–0.59% |
| 22 | 1 | 1,500 | 0.07% | 0.01%–0.38% |
| Position on the road | Successful rounds | Rounds in this demo run | Share of these rounds reaching the position | Range around this proportion |
|---|---|---|---|---|
| 1 | 1,225 | 1,500 | 81.67% | 79.63%–83.54% |
| 2 | 988 | 1,500 | 65.87% | 63.43%–68.22% |
| 3 | 792 | 1,500 | 52.8% | 50.27%–55.32% |
| 4 | 594 | 1,500 | 39.6% | 37.15%–42.1% |
| 5 | 441 | 1,500 | 29.4% | 27.15%–31.76% |
| 6 | 312 | 1,500 | 20.8% | 18.82%–22.93% |
| 7 | 238 | 1,500 | 15.87% | 14.11%–17.8% |
| 8 | 156 | 1,500 | 10.4% | 8.96%–12.05% |
| 9 | 94 | 1,500 | 6.27% | 5.15%–7.61% |
| 10 | 69 | 1,500 | 4.6% | 3.65%–5.78% |
| 11 | 48 | 1,500 | 3.2% | 2.42%–4.22% |
| 12 | 31 | 1,500 | 2.07% | 1.46%–2.92% |
| 13 | 23 | 1,500 | 1.53% | 1.02%–2.29% |
| 14 | 11 | 1,500 | 0.73% | 0.41%–1.31% |
| 15 | 6 | 1,500 | 0.4% | 0.18%–0.87% |
| 16 | 4 | 1,500 | 0.27% | 0.1%–0.68% |
| 17 | 1 | 1,500 | 0.07% | 0.01%–0.38% |
| 18 | 1 | 1,500 | 0.07% | 0.01%–0.38% |
| 19 | 0 | 1,500 | 0% | 0%–0.26% |
| 20 | 0 | 1,500 | 0% | 0%–0.26% |
| Position on the road | Successful rounds | Rounds in this demo run | Share of these rounds reaching the position | Range around this proportion |
|---|---|---|---|---|
| 1 | 891 | 1,500 | 59.4% | 56.89%–61.86% |
| 2 | 516 | 1,500 | 34.4% | 32.04%–36.84% |
| 3 | 291 | 1,500 | 19.4% | 17.48%–21.48% |
| 4 | 174 | 1,500 | 11.6% | 10.08%–13.32% |
| 5 | 98 | 1,500 | 6.53% | 5.39%–7.9% |
| 6 | 57 | 1,500 | 3.8% | 2.94%–4.89% |
| 7 | 26 | 1,500 | 1.73% | 1.19%–2.53% |
| 8 | 13 | 1,500 | 0.87% | 0.51%–1.48% |
| 9 | 5 | 1,500 | 0.33% | 0.14%–0.78% |
| 10 | 2 | 1,500 | 0.13% | 0.04%–0.48% |
| 11 | 0 | 1,500 | 0% | 0%–0.26% |
| 12 | 0 | 1,500 | 0% | 0%–0.26% |
| 13 | 0 | 1,500 | 0% | 0%–0.26% |
| 14 | 0 | 1,500 | 0% | 0%–0.26% |
| 15 | 0 | 1,500 | 0% | 0%–0.26% |
Demo observations. No forecasts. No independent RTP audit.
| Position on the road | Coefficient for this position | Survival under the stated model | Share of these rounds reaching the position | Gross return for each unit put at risk |
|---|---|---|---|---|
| 1 | 1.03× | 95.15% | 95.47% | 0.983 |
| 2 | 1.07× | 91.59% | 91.13% | 0.975 |
| 3 | 1.12× | 87.5% | 87.73% | 0.983 |
| 4 | 1.17× | 83.76% | 83.07% | 0.972 |
| 5 | 1.23× | 79.67% | 78.4% | 0.964 |
| 6 | 1.29× | 75.97% | 74.13% | 0.956 |
| 7 | 1.36× | 72.06% | 70.27% | 0.956 |
| 8 | 1.44× | 68.06% | 66.67% | 0.96 |
| 9 | 1.53× | 64.05% | 62.47% | 0.956 |
| 10 | 1.63× | 60.12% | 57.33% | 0.935 |
| 11 | 1.75× | 56% | 54.2% | 0.949 |
| 12 | 1.88× | 52.13% | 51.07% | 0.96 |
| 13 | 2.04× | 48.04% | 47.07% | 0.96 |
| 14 | 2.22× | 44.14% | 43.27% | 0.961 |
| 15 | 2.45× | 40% | 39.67% | 0.972 |
| 16 | 2.72× | 36.03% | 35.87% | 0.976 |
| 17 | 3.06× | 32.03% | 32.93% | 1.008 |
| 18 | 3.5× | 28% | 28.87% | 1.01 |
| 19 | 4.08× | 24.02% | 24.6% | 1.004 |
| 20 | 4.9× | 20% | 21% | 1.029 |
| 21 | 6.13× | 15.99% | 16.13% | 0.989 |
| 22 | 6.61× | 14.83% | 12.67% | 0.837 |
| 23 | 9.81× | 9.99% | 9% | 0.883 |
| 24 | 19.44× | 5.04% | 4.87% | 0.946 |
| Position on the road | Coefficient for this position | Survival under the stated model | Share of these rounds reaching the position | Gross return for each unit put at risk |
|---|---|---|---|---|
| 1 | 1.12× | 87.5% | 87.8% | 0.983 |
| 2 | 1.28× | 76.56% | 77.27% | 0.989 |
| 3 | 1.47× | 66.67% | 66.8% | 0.982 |
| 4 | 1.7× | 57.65% | 57.13% | 0.971 |
| 5 | 1.98× | 49.49% | 48.53% | 0.961 |
| 6 | 2.33× | 42.06% | 41% | 0.955 |
| 7 | 2.76× | 35.51% | 34.6% | 0.955 |
| 8 | 3.32× | 29.52% | 28.4% | 0.943 |
| 9 | 4.03× | 24.32% | 22.8% | 0.919 |
| 10 | 4.96× | 19.76% | 17.73% | 0.88 |
| 11 | 6.2× | 15.81% | 13.93% | 0.864 |
| 12 | 6.91× | 14.18% | 10.93% | 0.755 |
| 13 | 8.9× | 11.01% | 8.8% | 0.783 |
| 14 | 11.74× | 8.35% | 6.47% | 0.759 |
| 15 | 15.99× | 6.13% | 4.4% | 0.704 |
| 16 | 22.61× | 4.33% | 3.47% | 0.784 |
| 17 | 33.58× | 2.92% | 2.33% | 0.784 |
| 18 | 53.2× | 1.84% | 1.67% | 0.887 |
| 19 | 92.17× | 1.06% | 0.8% | 0.737 |
| 20 | 182.51× | 0.54% | 0.53% | 0.973 |
| 21 | 451.71× | 0.22% | 0.2% | 0.903 |
| 22 | 1,788.8× | 0.05% | 0.07% | 1.193 |
| Position on the road | Coefficient for this position | Survival under the stated model | Share of these rounds reaching the position | Gross return for each unit put at risk |
|---|---|---|---|---|
| 1 | 1.23× | 79.67% | 81.67% | 1.005 |
| 2 | 1.55× | 63.23% | 65.87% | 1.021 |
| 3 | 1.98× | 49.49% | 52.8% | 1.045 |
| 4 | 2.56× | 38.28% | 39.6% | 1.014 |
| 5 | 3.36× | 29.17% | 29.4% | 0.988 |
| 6 | 4.49× | 21.83% | 20.8% | 0.934 |
| 7 | 5.49× | 17.85% | 15.87% | 0.871 |
| 8 | 7.53× | 13.01% | 10.4% | 0.783 |
| 9 | 10.56× | 9.28% | 6.27% | 0.662 |
| 10 | 15.21× | 6.44% | 4.6% | 0.7 |
| 11 | 22.59× | 4.34% | 3.2% | 0.723 |
| 12 | 34.79× | 2.82% | 2.07% | 0.719 |
| 13 | 55.97× | 1.75% | 1.53% | 0.858 |
| 14 | 94.99× | 1.03% | 0.73% | 0.697 |
| 15 | 172.42× | 0.57% | 0.4% | 0.69 |
| 16 | 341.4× | 0.29% | 0.27% | 0.91 |
| 17 | 760.46× | 0.13% | 0.07% | 0.507 |
| 18 | 2,007.63× | 0.05% | 0.07% | 1.338 |
| 19 | 6,956.47× | 0.01% | 0% | 0 |
| 20 | 41,321.43× | 0% | 0% | 0 |
| Position on the road | Coefficient for this position | Survival under the stated model | Share of these rounds reaching the position | Gross return for each unit put at risk |
|---|---|---|---|---|
| 1 | 1.63× | 60.12% | 59.4% | 0.968 |
| 2 | 2.8× | 35% | 34.4% | 0.963 |
| 3 | 4.95× | 19.8% | 19.4% | 0.96 |
| 4 | 9.08× | 10.79% | 11.6% | 1.053 |
| 5 | 15.21× | 6.44% | 6.53% | 0.994 |
| 6 | 30.12× | 3.25% | 3.8% | 1.145 |
| 7 | 62.96× | 1.56% | 1.73% | 1.091 |
| 8 | 140.24× | 0.7% | 0.87% | 1.215 |
| 9 | 337.19× | 0.29% | 0.33% | 1.124 |
| 10 | 890.19× | 0.11% | 0.13% | 1.187 |
| 11 | 2,643.89× | 0.04% | 0% | 0 |
| 12 | 9,161.08× | 0.01% | 0% | 0 |
| 13 | 39,301.05× | 0% | 0% | 0 |
| 14 | 233,448.29× | 0% | 0% | 0 |
| 15 | 2,542,251.93× | 0% | 0% | 0 |
Gross return includes stake. Payout caps apply. No profit forecast.
Limited demo observations. No predictions. Independently unaudited.
Outcome generation: independently unverified by us.
Check algorithm, commitments, seeds and nonce.
The InOut title is a real casino game. That does not verify every casino or similarly named app; match the provider and check the operator separately.
The cash-out button banks the currently available return and closes the round. A casino withdrawal happens separately through its cashier.
No. InOut’s original-game figure is a theoretical long-run return equivalent to a 2% house edge, not a promised session result.
No. A step coefficient and the maximum-win ceiling are distinct figures; consult the rules to see how the ceiling limits a reached return.
No. Original-game demo credits are only for practice; they cannot be withdrawn and stay separate from real-money funds.
A missing withdrawal is handled by the casino where you hold the account. Contact its support with the transaction reference, without sharing credentials with a search result.
18+ only. Limit time and spending. Take breaks. Never chase losses.
Theoretical return stated by the maker: 95.5% · Game payment ceiling: 20,000 USD
Model: RTP ÷ multiplier. Independently unverified.
| Position on the road | Share of these rounds reaching the position | Range around this proportion | Survival under the stated model |
|---|---|---|---|
| 1 | 95.47% | 94.29% – 96.41% | 95.15% |
| 2 | 91.13% | 89.59% – 92.47% | 91.59% |
| 3 | 87.73% | 85.98% – 89.3% | 87.5% |
| 4 | 83.07% | 81.08% – 84.88% | 83.76% |
| 5 | 78.4% | 76.25% – 80.41% | 79.67% |
| 6 | 74.13% | 71.86% – 76.29% | 75.97% |
| 7 | 70.27% | 67.9% – 72.53% | 72.06% |
| 8 | 66.67% | 64.24% – 69.01% | 68.06% |
| 9 | 62.47% | 59.99% – 64.88% | 64.05% |
| 10 | 57.33% | 54.81% – 59.81% | 60.12% |
| 11 | 54.2% | 51.67% – 56.71% | 56% |
| 12 | 51.07% | 48.54% – 53.59% | 52.13% |
| 13 | 47.07% | 44.55% – 49.6% | 48.04% |
| 14 | 43.27% | 40.78% – 45.79% | 44.14% |
| 15 | 39.67% | 37.22% – 42.17% | 40% |
| 16 | 35.87% | 33.48% – 38.33% | 36.03% |
| 17 | 32.93% | 30.6% – 35.35% | 32.03% |
| 18 | 28.87% | 26.63% – 31.21% | 28% |
| 19 | 24.6% | 22.49% – 26.84% | 24.02% |
| 20 | 21% | 19.01% – 23.13% | 20% |
| 21 | 16.13% | 14.36% – 18.08% | 15.99% |
| 22 | 12.67% | 11.08% – 14.45% | 14.83% |
| 23 | 9% | 7.65% – 10.55% | 9.99% |
| 24 | 4.87% | 3.89% – 6.08% | 5.04% |
| Position on the road | Share of these rounds reaching the position | Range around this proportion | Survival under the stated model |
|---|---|---|---|
| 1 | 87.8% | 86.05% – 89.36% | 87.5% |
| 2 | 77.27% | 75.08% – 79.32% | 76.56% |
| 3 | 66.8% | 64.38% – 69.14% | 66.67% |
| 4 | 57.13% | 54.61% – 59.62% | 57.65% |
| 5 | 48.53% | 46.01% – 51.06% | 49.49% |
| 6 | 41% | 38.54% – 43.51% | 42.06% |
| 7 | 34.6% | 32.23% – 37.04% | 35.51% |
| 8 | 28.4% | 26.18% – 30.73% | 29.52% |
| 9 | 22.8% | 20.75% – 24.99% | 24.32% |
| 10 | 17.73% | 15.88% – 19.75% | 19.76% |
| 11 | 13.93% | 12.27% – 15.78% | 15.81% |
| 12 | 10.93% | 9.45% – 12.61% | 14.18% |
| 13 | 8.8% | 7.47% – 10.34% | 11.01% |
| 14 | 6.47% | 5.33% – 7.83% | 8.35% |
| 15 | 4.4% | 3.47% – 5.56% | 6.13% |
| 16 | 3.47% | 2.65% – 4.52% | 4.33% |
| 17 | 2.33% | 1.68% – 3.23% | 2.92% |
| 18 | 1.67% | 1.13% – 2.45% | 1.84% |
| 19 | 0.8% | 0.46% – 1.39% | 1.06% |
| 20 | 0.53% | 0.27% – 1.05% | 0.54% |
| 21 | 0.2% | 0.07% – 0.59% | 0.22% |
| 22 | 0.07% | 0.01% – 0.38% | 0.05% |
| Position on the road | Share of these rounds reaching the position | Range around this proportion | Survival under the stated model |
|---|---|---|---|
| 1 | 81.67% | 79.63% – 83.54% | 79.67% |
| 2 | 65.87% | 63.43% – 68.22% | 63.23% |
| 3 | 52.8% | 50.27% – 55.32% | 49.49% |
| 4 | 39.6% | 37.15% – 42.1% | 38.28% |
| 5 | 29.4% | 27.15% – 31.76% | 29.17% |
| 6 | 20.8% | 18.82% – 22.93% | 21.83% |
| 7 | 15.87% | 14.11% – 17.8% | 17.85% |
| 8 | 10.4% | 8.96% – 12.05% | 13.01% |
| 9 | 6.27% | 5.15% – 7.61% | 9.28% |
| 10 | 4.6% | 3.65% – 5.78% | 6.44% |
| 11 | 3.2% | 2.42% – 4.22% | 4.34% |
| 12 | 2.07% | 1.46% – 2.92% | 2.82% |
| 13 | 1.53% | 1.02% – 2.29% | 1.75% |
| 14 | 0.73% | 0.41% – 1.31% | 1.03% |
| 15 | 0.4% | 0.18% – 0.87% | 0.57% |
| 16 | 0.27% | 0.1% – 0.68% | 0.29% |
| 17 | 0.07% | 0.01% – 0.38% | 0.13% |
| 18 | 0.07% | 0.01% – 0.38% | 0.05% |
| 19 | 0% | 0% – 0.26% | 0.01% |
| 20 | 0% | 0% – 0.26% | 0% |
| Position on the road | Share of these rounds reaching the position | Range around this proportion | Survival under the stated model |
|---|---|---|---|
| 1 | 59.4% | 56.89% – 61.86% | 60.12% |
| 2 | 34.4% | 32.04% – 36.84% | 35% |
| 3 | 19.4% | 17.48% – 21.48% | 19.8% |
| 4 | 11.6% | 10.08% – 13.32% | 10.79% |
| 5 | 6.53% | 5.39% – 7.9% | 6.44% |
| 6 | 3.8% | 2.94% – 4.89% | 3.25% |
| 7 | 1.73% | 1.19% – 2.53% | 1.56% |
| 8 | 0.87% | 0.51% – 1.48% | 0.7% |
| 9 | 0.33% | 0.14% – 0.78% | 0.29% |
| 10 | 0.13% | 0.04% – 0.48% | 0.11% |
| 11 | 0% | 0% – 0.26% | 0.04% |
| 12 | 0% | 0% – 0.26% | 0.01% |
| 13 | 0% | 0% – 0.26% | 0% |
| 14 | 0% | 0% – 0.26% | 0% |
| 15 | 0% | 0% – 0.26% | 0% |
Chicken Road