Chicken Road
Share reaching each successful step
Easy settingMedium settingHard settingDaredevil setting

Chicken Road Wins title 1 of 2 · InOut Games · 2024
InOut Games makes Chicken Road, a casino title based on successive crossings. You commit a stake, move across the road and collect whenever a successful position offers an amount you want to take. Continuing keeps that amount exposed to the next move. If the chicken fails, the round ends without that cash-out. That simple switch between an available return and another attempt drives the entire game.
Chicken Road Wins research team · How we approach the road numbers

Free practice credits. No withdrawals. Adults 18+.
RTP stated by the developer: 98% · Upper payout amount: 10,000 USD · Naira for your personal budget: NGN (₦); USD amounts describe the provider's game limits
Read the full title breakdownThe action can look like an arcade crossing game, but timing a tap does not choose a safe gap. Choose your stake and difficulty, then decide whether to collect after a successful crossing. Before using money, watch a demo move and find the point at which the display changes from the next possible coefficient to an amount you can actually collect. They serve different purposes. Neither a tiny-looking game minimum nor a huge final coefficient tells you the amount a casino will ask you to deposit.
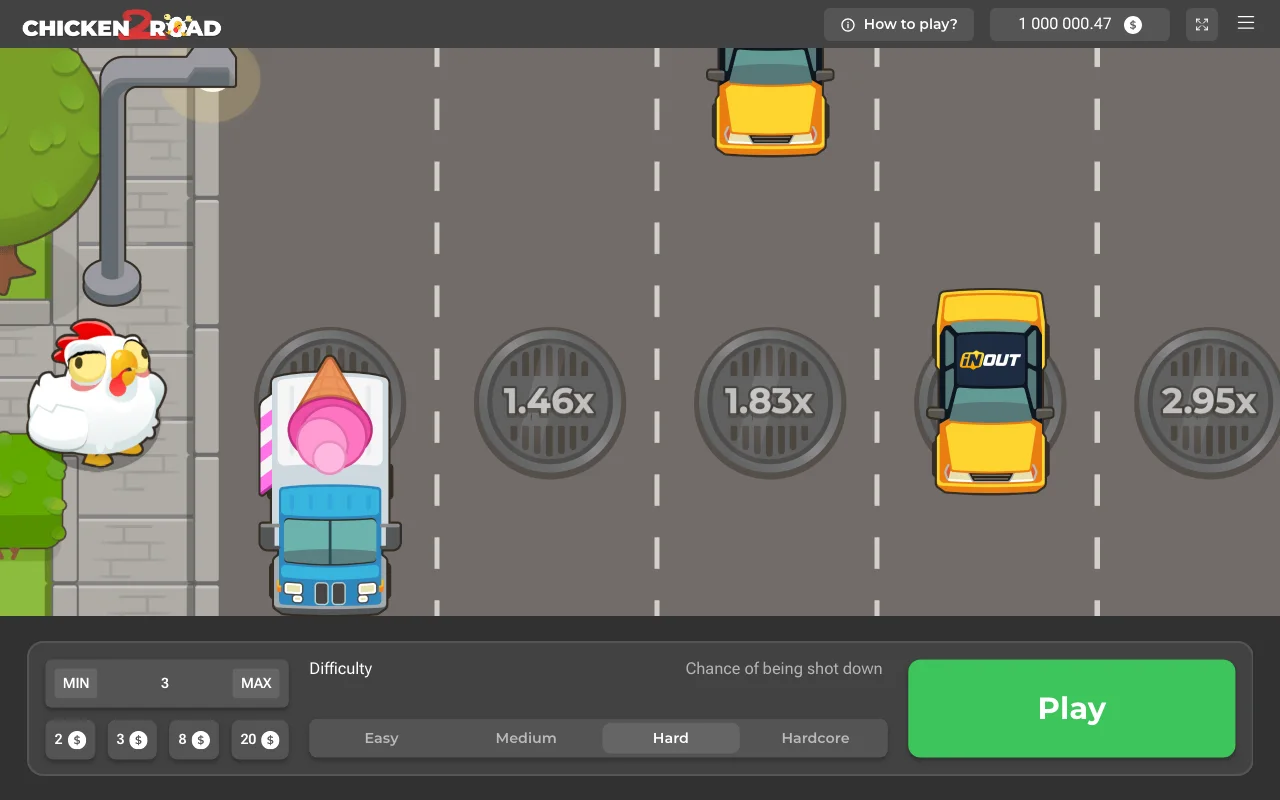
InOut released the original on 4 April 2024. Look for Chicken Road and the InOut Games provider name inside the play view. The sequel is called Chicken Road 2 and uses different roads. Similar artwork or a chicken crossing animation is not enough to establish which title you have opened.
The original has four difficulty labels: Easy, Medium, Hard and Daredevil. Read those labels before comparing a multiplier from a video with one on your phone. A position on Easy does not carry the same coefficient as the same position on Hard. A named mode is a concrete reference; a social post calling a round hardcore may not be.
There is no need for an extra install to understand the mechanics. The browser demo shows the road and collection control together. Once you can identify the selected difficulty and the stake in an inactive round, the larger coefficients become easier to put in context.
Easy is the longest road in the first game, with 24 positions. Its first coefficients are ×1.03, ×1.07 and ×1.12. Later, the ladder passes ×1.88 and ×2.04 before reaching ×3.06, ×4.90 and finally ×19.44. Those are separate points along the route, not values to choose freely before the opening move.
A small opening increase can make the early screen look calm. It still follows a random result, and another attempted crossing can lose the stake. What Easy gives you visually is a longer ladder with more collection decisions before its endpoint. It does not turn the round into a bank balance that grows automatically.
In a demo, try collecting before the midpoint and watch how the round closes. Then start a new attempt with the same practice stake. Comparing the controls under stable settings is more useful for understanding Easy than changing the stake every time the screen looks promising.
Medium contains 22 positions and opens at ×1.12. Its ladder moves through ×1.98, ×4.96 and ×15.99 before the final ×1,788.80. Hard has 20 positions, beginning at ×1.23 and ending at ×41,321.43. Its opening values include ×1.55 and ×1.98, so the progression differs right from the start.
The shorter route changes how quickly the displayed amounts grow. That growth is the trade-off you see on screen. It should not be read as a shortcut around random outcomes.
Promotional game clips often focus on spectacular late-round outcomes. A clip may omit the earlier attempts, the mode and the amount committed. Reading the entire ladder gives a fuller picture of the offered amounts, while the maximum-win rule limits how those amounts can turn into a payout.
Daredevil gives the original only 15 positions. It begins at ×1.63, then ×2.80 and ×4.95. The ladder later rises through ×62.96 and ×890.19 before ending at ×2,542,251.93. Those large jumps are why the endpoint attracts so much attention in videos and adverts.
The game maximum remains 10,000 USD. Read the cap with the ladder, particularly when a social post presents the largest coefficient as if it were an unlimited cheque.
Daredevil is not a separate skill level that you unlock by mastering Easy. Familiarity can help you find the controls, but it cannot train the random outcome to favour you.
The original accepts stakes from 0.01 to 150 USD at provider level and sets a 10,000 USD maximum win. A casino may display its game in another supported account currency. Read the actual amount and currency in your play window; do not treat a printed USD minimum as a minimum in another currency.
Your deposit is a separate transaction. The casino sets its own deposit methods, conditions and cash-out process. A game allowing a small round stake does not mean a payment service will accept an equally small deposit. Likewise, the game's maximum win is not the operator's withdrawal processing limit.
For budgeting, begin with an amount you can spare for leisure and understand the amount each round deducts from that allowance. No exchange rate is assumed here. If a cashier or game view converts currencies, read the quoted conversion and any charges there before approving the transaction.
InOut publishes 98% RTP for Chicken Road. Its complement is a 2% house edge over the long run under that return model. This is a mathematical description across extensive play, rather than a promise that your deposit will come back almost intact. An individual session can finish far above or below the stated average.
The number does not tell you which position to collect or which upcoming crossing will fail. It also does not remove the payout ceiling. RTP describes theoretical return. The ladder shows the multiplier at each position, while the maximum win caps how much a round can pay.
Do not carry the percentage into the sequel. To understand the original game review, Chicken Road 2 RTP is 95.5% per InOut. Sharing a developer and a road theme is not enough to share a return figure. Compare the original’s 98% and the sequel’s 95.5% in separate columns.
The ladder table lists coefficients position by position. Use it to match the selected mode with the figure on screen. The demo totals below it describe completed attempts rather than the mathematical rate promised for a new one. Check the mode and dates beside those totals before comparing them with another chart.
A high return in one attempt and a large group of early failures can coexist. Looking only at the best multiplier hides the distribution. The useful chart question is what happened across the attempts shown, with their count in view. It is not whether a particular pattern has scheduled your next success.
A survival line and a payout ladder should therefore be read together without merging their meanings. The line shows how often those attempts reached a position. The ladder lists its multiplier, which is a return factor rather than a frequency. Neither can turn a future crossing into a certainty.
After a successful move, the collect button gives the round a stopping point. Taking it ends the round at the amount displayed, subject to the game rules. Choosing another move puts that collection opportunity behind the next outcome. That is why the current amount deserves more attention than a bright tile farther along the road.
A calculator can help distinguish gross return from gain above the stake. Gross includes your starting stake. If you compare it directly with a balance change without accounting for the committed amount, the round can look more profitable than it was. Follow the balance through a completed demo attempt to see both sides of the transaction.
There is no universal best cash-out position. A position someone else selected reflects their decision in that attempt. It does not tell you the next outcome or establish an optimal target for your own money.
On mobile, keep the amount, mode and collect button visible without awkward scrolling. Rotate the display while no round is active if that makes the layout easier to read. If the connection pauses, wait for a settled round status before starting again. A second tap is not a connection repair. Look separately at deposit and withdrawal choices, identity requirements and any currency conversion. Ask the casino about an account transaction; InOut's multiplier ladder cannot answer where a transfer has gone. A working mobile page does not answer that question. Keep the operator's identity and account terms alongside the game facts when deciding whether to proceed.
The original is straightforward to understand visually: four roads, a visible coefficient at each position and a decision after successful progress. Easy offers the longest route in this version, while the shorter modes make the growing amounts more dramatic. The separate ladder tables make those differences easier to compare than a single game score would.
Its limitations matter to the choice too. You cannot steer away a random failure, and the biggest coefficient still meets the provider ceiling. Neither a chart nor an experienced player's habit turns the game into a source of regular income. If the simple decision interests you, a demo is enough to explore it.
For a sequel comparison, focus on the changed road lengths, minimum stake and maximum win. That is a clearer reason to open the next review than assuming a newer title must suit you better. The two games deserve separate amounts and separate expectations.
Adults 18+ only: choose time and money limits before using the original game review, take breaks and never chase losses.
Inside the recorded sample
Fixed starting denominator. Pointwise Wilson intervals. No simultaneous curve coverage.
Attempts in the demo totals: 6,000
Share reaching each successful step
| Game | Selected setting | Attempts in the demo totals | Step one survival | Range of statistical uncertainty | Completed roads | Largest multiplier in these attempts |
|---|---|---|---|---|---|---|
| Chicken Road · Easy setting | Easy setting | 1,500 | 95.47% | 94.29%–96.41% | 73 | 19.44× |
| Chicken Road · Medium setting | Medium setting | 1,500 | 87.8% | 86.05%–89.36% | 1 | 1,788.8× |
| Chicken Road · Hard setting | Hard setting | 1,500 | 81.67% | 79.63%–83.54% | 0 | 2,007.63× |
| Chicken Road · Daredevil setting | Daredevil setting | 1,500 | 59.4% | 56.89%–61.86% | 0 | 890.19× |
Highest successful step, including later losses. No paid prize.
| Position on the road | Successful rounds | Attempts in the demo totals | Demo attempts reaching this point | Range of statistical uncertainty |
|---|---|---|---|---|
| 1 | 1,432 | 1,500 | 95.47% | 94.29%–96.41% |
| 2 | 1,367 | 1,500 | 91.13% | 89.59%–92.47% |
| 3 | 1,316 | 1,500 | 87.73% | 85.98%–89.3% |
| 4 | 1,246 | 1,500 | 83.07% | 81.08%–84.88% |
| 5 | 1,176 | 1,500 | 78.4% | 76.25%–80.41% |
| 6 | 1,112 | 1,500 | 74.13% | 71.86%–76.29% |
| 7 | 1,054 | 1,500 | 70.27% | 67.9%–72.53% |
| 8 | 1,000 | 1,500 | 66.67% | 64.24%–69.01% |
| 9 | 937 | 1,500 | 62.47% | 59.99%–64.88% |
| 10 | 860 | 1,500 | 57.33% | 54.81%–59.81% |
| 11 | 813 | 1,500 | 54.2% | 51.67%–56.71% |
| 12 | 766 | 1,500 | 51.07% | 48.54%–53.59% |
| 13 | 706 | 1,500 | 47.07% | 44.55%–49.6% |
| 14 | 649 | 1,500 | 43.27% | 40.78%–45.79% |
| 15 | 595 | 1,500 | 39.67% | 37.22%–42.17% |
| 16 | 538 | 1,500 | 35.87% | 33.48%–38.33% |
| 17 | 494 | 1,500 | 32.93% | 30.6%–35.35% |
| 18 | 433 | 1,500 | 28.87% | 26.63%–31.21% |
| 19 | 369 | 1,500 | 24.6% | 22.49%–26.84% |
| 20 | 315 | 1,500 | 21% | 19.01%–23.13% |
| 21 | 242 | 1,500 | 16.13% | 14.36%–18.08% |
| 22 | 190 | 1,500 | 12.67% | 11.08%–14.45% |
| 23 | 135 | 1,500 | 9% | 7.65%–10.55% |
| 24 | 73 | 1,500 | 4.87% | 3.89%–6.08% |
| Position on the road | Successful rounds | Attempts in the demo totals | Demo attempts reaching this point | Range of statistical uncertainty |
|---|---|---|---|---|
| 1 | 1,317 | 1,500 | 87.8% | 86.05%–89.36% |
| 2 | 1,159 | 1,500 | 77.27% | 75.08%–79.32% |
| 3 | 1,002 | 1,500 | 66.8% | 64.38%–69.14% |
| 4 | 857 | 1,500 | 57.13% | 54.61%–59.62% |
| 5 | 728 | 1,500 | 48.53% | 46.01%–51.06% |
| 6 | 615 | 1,500 | 41% | 38.54%–43.51% |
| 7 | 519 | 1,500 | 34.6% | 32.23%–37.04% |
| 8 | 426 | 1,500 | 28.4% | 26.18%–30.73% |
| 9 | 342 | 1,500 | 22.8% | 20.75%–24.99% |
| 10 | 266 | 1,500 | 17.73% | 15.88%–19.75% |
| 11 | 209 | 1,500 | 13.93% | 12.27%–15.78% |
| 12 | 164 | 1,500 | 10.93% | 9.45%–12.61% |
| 13 | 132 | 1,500 | 8.8% | 7.47%–10.34% |
| 14 | 97 | 1,500 | 6.47% | 5.33%–7.83% |
| 15 | 66 | 1,500 | 4.4% | 3.47%–5.56% |
| 16 | 52 | 1,500 | 3.47% | 2.65%–4.52% |
| 17 | 35 | 1,500 | 2.33% | 1.68%–3.23% |
| 18 | 25 | 1,500 | 1.67% | 1.13%–2.45% |
| 19 | 12 | 1,500 | 0.8% | 0.46%–1.39% |
| 20 | 8 | 1,500 | 0.53% | 0.27%–1.05% |
| 21 | 3 | 1,500 | 0.2% | 0.07%–0.59% |
| 22 | 1 | 1,500 | 0.07% | 0.01%–0.38% |
| Position on the road | Successful rounds | Attempts in the demo totals | Demo attempts reaching this point | Range of statistical uncertainty |
|---|---|---|---|---|
| 1 | 1,225 | 1,500 | 81.67% | 79.63%–83.54% |
| 2 | 988 | 1,500 | 65.87% | 63.43%–68.22% |
| 3 | 792 | 1,500 | 52.8% | 50.27%–55.32% |
| 4 | 594 | 1,500 | 39.6% | 37.15%–42.1% |
| 5 | 441 | 1,500 | 29.4% | 27.15%–31.76% |
| 6 | 312 | 1,500 | 20.8% | 18.82%–22.93% |
| 7 | 238 | 1,500 | 15.87% | 14.11%–17.8% |
| 8 | 156 | 1,500 | 10.4% | 8.96%–12.05% |
| 9 | 94 | 1,500 | 6.27% | 5.15%–7.61% |
| 10 | 69 | 1,500 | 4.6% | 3.65%–5.78% |
| 11 | 48 | 1,500 | 3.2% | 2.42%–4.22% |
| 12 | 31 | 1,500 | 2.07% | 1.46%–2.92% |
| 13 | 23 | 1,500 | 1.53% | 1.02%–2.29% |
| 14 | 11 | 1,500 | 0.73% | 0.41%–1.31% |
| 15 | 6 | 1,500 | 0.4% | 0.18%–0.87% |
| 16 | 4 | 1,500 | 0.27% | 0.1%–0.68% |
| 17 | 1 | 1,500 | 0.07% | 0.01%–0.38% |
| 18 | 1 | 1,500 | 0.07% | 0.01%–0.38% |
| 19 | 0 | 1,500 | 0% | 0%–0.26% |
| 20 | 0 | 1,500 | 0% | 0%–0.26% |
| Position on the road | Successful rounds | Attempts in the demo totals | Demo attempts reaching this point | Range of statistical uncertainty |
|---|---|---|---|---|
| 1 | 891 | 1,500 | 59.4% | 56.89%–61.86% |
| 2 | 516 | 1,500 | 34.4% | 32.04%–36.84% |
| 3 | 291 | 1,500 | 19.4% | 17.48%–21.48% |
| 4 | 174 | 1,500 | 11.6% | 10.08%–13.32% |
| 5 | 98 | 1,500 | 6.53% | 5.39%–7.9% |
| 6 | 57 | 1,500 | 3.8% | 2.94%–4.89% |
| 7 | 26 | 1,500 | 1.73% | 1.19%–2.53% |
| 8 | 13 | 1,500 | 0.87% | 0.51%–1.48% |
| 9 | 5 | 1,500 | 0.33% | 0.14%–0.78% |
| 10 | 2 | 1,500 | 0.13% | 0.04%–0.48% |
| 11 | 0 | 1,500 | 0% | 0%–0.26% |
| 12 | 0 | 1,500 | 0% | 0%–0.26% |
| 13 | 0 | 1,500 | 0% | 0%–0.26% |
| 14 | 0 | 1,500 | 0% | 0%–0.26% |
| 15 | 0 | 1,500 | 0% | 0%–0.26% |
Demo observations. No forecasts. No independent RTP audit.
Chicken Road is an InOut gambling title in which successful moves increase a possible cash-out and a failed move loses the round stake. It shares the broad crossing theme with some arcade games, but this title uses stakes and random outcomes.
To understand the original game review, inOut does not supply a standalone Chicken Road app. Browser access may be available through a casino, while similarly named store products can be third-party titles or clones. Read the provider name inside the game rather than trusting the icon.
Easy has 24 positions, ahead of Medium with 22, Hard with 20 and Daredevil with 15. The longest road also has a different multiplier ladder; position count alone does not describe the amounts offered.
InOut states 98% RTP for Chicken Road, which corresponds to a 2% long-run house edge. It is a theoretical figure across extensive play and does not fix the result of your own session.
No. The 0.01 USD provider minimum stays a USD figure here. Your casino may display another account currency, so read the actual currency and amount before committing a round stake.
No. The original’s 10,000 USD maximum win remains relevant even when stake multiplied by coefficient gives a larger result. A ladder endpoint describes the game position rather than an unrestricted withdrawal amount.
Chicken Road
Model: RTP ÷ multiplier. Independently unverified.
| Position on the road | Demo attempts reaching this point | Range of statistical uncertainty | Survival under the model |
|---|---|---|---|
| 1 | 95.47% | 94.29% – 96.41% | 95.15% |
| 2 | 91.13% | 89.59% – 92.47% | 91.59% |
| 3 | 87.73% | 85.98% – 89.3% | 87.5% |
| 4 | 83.07% | 81.08% – 84.88% | 83.76% |
| 5 | 78.4% | 76.25% – 80.41% | 79.67% |
| 6 | 74.13% | 71.86% – 76.29% | 75.97% |
| 7 | 70.27% | 67.9% – 72.53% | 72.06% |
| 8 | 66.67% | 64.24% – 69.01% | 68.06% |
| 9 | 62.47% | 59.99% – 64.88% | 64.05% |
| 10 | 57.33% | 54.81% – 59.81% | 60.12% |
| 11 | 54.2% | 51.67% – 56.71% | 56% |
| 12 | 51.07% | 48.54% – 53.59% | 52.13% |
| 13 | 47.07% | 44.55% – 49.6% | 48.04% |
| 14 | 43.27% | 40.78% – 45.79% | 44.14% |
| 15 | 39.67% | 37.22% – 42.17% | 40% |
| 16 | 35.87% | 33.48% – 38.33% | 36.03% |
| 17 | 32.93% | 30.6% – 35.35% | 32.03% |
| 18 | 28.87% | 26.63% – 31.21% | 28% |
| 19 | 24.6% | 22.49% – 26.84% | 24.02% |
| 20 | 21% | 19.01% – 23.13% | 20% |
| 21 | 16.13% | 14.36% – 18.08% | 15.99% |
| 22 | 12.67% | 11.08% – 14.45% | 14.83% |
| 23 | 9% | 7.65% – 10.55% | 9.99% |
| 24 | 4.87% | 3.89% – 6.08% | 5.04% |
| Position on the road | Demo attempts reaching this point | Range of statistical uncertainty | Survival under the model |
|---|---|---|---|
| 1 | 87.8% | 86.05% – 89.36% | 87.5% |
| 2 | 77.27% | 75.08% – 79.32% | 76.56% |
| 3 | 66.8% | 64.38% – 69.14% | 66.67% |
| 4 | 57.13% | 54.61% – 59.62% | 57.65% |
| 5 | 48.53% | 46.01% – 51.06% | 49.49% |
| 6 | 41% | 38.54% – 43.51% | 42.06% |
| 7 | 34.6% | 32.23% – 37.04% | 35.51% |
| 8 | 28.4% | 26.18% – 30.73% | 29.52% |
| 9 | 22.8% | 20.75% – 24.99% | 24.32% |
| 10 | 17.73% | 15.88% – 19.75% | 19.76% |
| 11 | 13.93% | 12.27% – 15.78% | 15.81% |
| 12 | 10.93% | 9.45% – 12.61% | 14.18% |
| 13 | 8.8% | 7.47% – 10.34% | 11.01% |
| 14 | 6.47% | 5.33% – 7.83% | 8.35% |
| 15 | 4.4% | 3.47% – 5.56% | 6.13% |
| 16 | 3.47% | 2.65% – 4.52% | 4.33% |
| 17 | 2.33% | 1.68% – 3.23% | 2.92% |
| 18 | 1.67% | 1.13% – 2.45% | 1.84% |
| 19 | 0.8% | 0.46% – 1.39% | 1.06% |
| 20 | 0.53% | 0.27% – 1.05% | 0.54% |
| 21 | 0.2% | 0.07% – 0.59% | 0.22% |
| 22 | 0.07% | 0.01% – 0.38% | 0.05% |
| Position on the road | Demo attempts reaching this point | Range of statistical uncertainty | Survival under the model |
|---|---|---|---|
| 1 | 81.67% | 79.63% – 83.54% | 79.67% |
| 2 | 65.87% | 63.43% – 68.22% | 63.23% |
| 3 | 52.8% | 50.27% – 55.32% | 49.49% |
| 4 | 39.6% | 37.15% – 42.1% | 38.28% |
| 5 | 29.4% | 27.15% – 31.76% | 29.17% |
| 6 | 20.8% | 18.82% – 22.93% | 21.83% |
| 7 | 15.87% | 14.11% – 17.8% | 17.85% |
| 8 | 10.4% | 8.96% – 12.05% | 13.01% |
| 9 | 6.27% | 5.15% – 7.61% | 9.28% |
| 10 | 4.6% | 3.65% – 5.78% | 6.44% |
| 11 | 3.2% | 2.42% – 4.22% | 4.34% |
| 12 | 2.07% | 1.46% – 2.92% | 2.82% |
| 13 | 1.53% | 1.02% – 2.29% | 1.75% |
| 14 | 0.73% | 0.41% – 1.31% | 1.03% |
| 15 | 0.4% | 0.18% – 0.87% | 0.57% |
| 16 | 0.27% | 0.1% – 0.68% | 0.29% |
| 17 | 0.07% | 0.01% – 0.38% | 0.13% |
| 18 | 0.07% | 0.01% – 0.38% | 0.05% |
| 19 | 0% | 0% – 0.26% | 0.01% |
| 20 | 0% | 0% – 0.26% | 0% |
| Position on the road | Demo attempts reaching this point | Range of statistical uncertainty | Survival under the model |
|---|---|---|---|
| 1 | 59.4% | 56.89% – 61.86% | 60.12% |
| 2 | 34.4% | 32.04% – 36.84% | 35% |
| 3 | 19.4% | 17.48% – 21.48% | 19.8% |
| 4 | 11.6% | 10.08% – 13.32% | 10.79% |
| 5 | 6.53% | 5.39% – 7.9% | 6.44% |
| 6 | 3.8% | 2.94% – 4.89% | 3.25% |
| 7 | 1.73% | 1.19% – 2.53% | 1.56% |
| 8 | 0.87% | 0.51% – 1.48% | 0.7% |
| 9 | 0.33% | 0.14% – 0.78% | 0.29% |
| 10 | 0.13% | 0.04% – 0.48% | 0.11% |
| 11 | 0% | 0% – 0.26% | 0.04% |
| 12 | 0% | 0% – 0.26% | 0.01% |
| 13 | 0% | 0% – 0.26% | 0% |
| 14 | 0% | 0% – 0.26% | 0% |
| 15 | 0% | 0% – 0.26% | 0% |
| Position on the road | Multiplier at this position | Survival under the model | Demo attempts reaching this point | Gross return for each unit of stake |
|---|---|---|---|---|
| 1 | 1.03× | 95.15% | 95.47% | 0.983 |
| 2 | 1.07× | 91.59% | 91.13% | 0.975 |
| 3 | 1.12× | 87.5% | 87.73% | 0.983 |
| 4 | 1.17× | 83.76% | 83.07% | 0.972 |
| 5 | 1.23× | 79.67% | 78.4% | 0.964 |
| 6 | 1.29× | 75.97% | 74.13% | 0.956 |
| 7 | 1.36× | 72.06% | 70.27% | 0.956 |
| 8 | 1.44× | 68.06% | 66.67% | 0.96 |
| 9 | 1.53× | 64.05% | 62.47% | 0.956 |
| 10 | 1.63× | 60.12% | 57.33% | 0.935 |
| 11 | 1.75× | 56% | 54.2% | 0.949 |
| 12 | 1.88× | 52.13% | 51.07% | 0.96 |
| 13 | 2.04× | 48.04% | 47.07% | 0.96 |
| 14 | 2.22× | 44.14% | 43.27% | 0.961 |
| 15 | 2.45× | 40% | 39.67% | 0.972 |
| 16 | 2.72× | 36.03% | 35.87% | 0.976 |
| 17 | 3.06× | 32.03% | 32.93% | 1.008 |
| 18 | 3.5× | 28% | 28.87% | 1.01 |
| 19 | 4.08× | 24.02% | 24.6% | 1.004 |
| 20 | 4.9× | 20% | 21% | 1.029 |
| 21 | 6.13× | 15.99% | 16.13% | 0.989 |
| 22 | 6.61× | 14.83% | 12.67% | 0.837 |
| 23 | 9.81× | 9.99% | 9% | 0.883 |
| 24 | 19.44× | 5.04% | 4.87% | 0.946 |
| Position on the road | Multiplier at this position | Survival under the model | Demo attempts reaching this point | Gross return for each unit of stake |
|---|---|---|---|---|
| 1 | 1.12× | 87.5% | 87.8% | 0.983 |
| 2 | 1.28× | 76.56% | 77.27% | 0.989 |
| 3 | 1.47× | 66.67% | 66.8% | 0.982 |
| 4 | 1.7× | 57.65% | 57.13% | 0.971 |
| 5 | 1.98× | 49.49% | 48.53% | 0.961 |
| 6 | 2.33× | 42.06% | 41% | 0.955 |
| 7 | 2.76× | 35.51% | 34.6% | 0.955 |
| 8 | 3.32× | 29.52% | 28.4% | 0.943 |
| 9 | 4.03× | 24.32% | 22.8% | 0.919 |
| 10 | 4.96× | 19.76% | 17.73% | 0.88 |
| 11 | 6.2× | 15.81% | 13.93% | 0.864 |
| 12 | 6.91× | 14.18% | 10.93% | 0.755 |
| 13 | 8.9× | 11.01% | 8.8% | 0.783 |
| 14 | 11.74× | 8.35% | 6.47% | 0.759 |
| 15 | 15.99× | 6.13% | 4.4% | 0.704 |
| 16 | 22.61× | 4.33% | 3.47% | 0.784 |
| 17 | 33.58× | 2.92% | 2.33% | 0.784 |
| 18 | 53.2× | 1.84% | 1.67% | 0.887 |
| 19 | 92.17× | 1.06% | 0.8% | 0.737 |
| 20 | 182.51× | 0.54% | 0.53% | 0.973 |
| 21 | 451.71× | 0.22% | 0.2% | 0.903 |
| 22 | 1,788.8× | 0.05% | 0.07% | 1.193 |
| Position on the road | Multiplier at this position | Survival under the model | Demo attempts reaching this point | Gross return for each unit of stake |
|---|---|---|---|---|
| 1 | 1.23× | 79.67% | 81.67% | 1.005 |
| 2 | 1.55× | 63.23% | 65.87% | 1.021 |
| 3 | 1.98× | 49.49% | 52.8% | 1.045 |
| 4 | 2.56× | 38.28% | 39.6% | 1.014 |
| 5 | 3.36× | 29.17% | 29.4% | 0.988 |
| 6 | 4.49× | 21.83% | 20.8% | 0.934 |
| 7 | 5.49× | 17.85% | 15.87% | 0.871 |
| 8 | 7.53× | 13.01% | 10.4% | 0.783 |
| 9 | 10.56× | 9.28% | 6.27% | 0.662 |
| 10 | 15.21× | 6.44% | 4.6% | 0.7 |
| 11 | 22.59× | 4.34% | 3.2% | 0.723 |
| 12 | 34.79× | 2.82% | 2.07% | 0.719 |
| 13 | 55.97× | 1.75% | 1.53% | 0.858 |
| 14 | 94.99× | 1.03% | 0.73% | 0.697 |
| 15 | 172.42× | 0.57% | 0.4% | 0.69 |
| 16 | 341.4× | 0.29% | 0.27% | 0.91 |
| 17 | 760.46× | 0.13% | 0.07% | 0.507 |
| 18 | 2,007.63× | 0.05% | 0.07% | 1.338 |
| 19 | 6,956.47× | 0.01% | 0% | 0 |
| 20 | 41,321.43× | 0% | 0% | 0 |
| Position on the road | Multiplier at this position | Survival under the model | Demo attempts reaching this point | Gross return for each unit of stake |
|---|---|---|---|---|
| 1 | 1.63× | 60.12% | 59.4% | 0.968 |
| 2 | 2.8× | 35% | 34.4% | 0.963 |
| 3 | 4.95× | 19.8% | 19.4% | 0.96 |
| 4 | 9.08× | 10.79% | 11.6% | 1.053 |
| 5 | 15.21× | 6.44% | 6.53% | 0.994 |
| 6 | 30.12× | 3.25% | 3.8% | 1.145 |
| 7 | 62.96× | 1.56% | 1.73% | 1.091 |
| 8 | 140.24× | 0.7% | 0.87% | 1.215 |
| 9 | 337.19× | 0.29% | 0.33% | 1.124 |
| 10 | 890.19× | 0.11% | 0.13% | 1.187 |
| 11 | 2,643.89× | 0.04% | 0% | 0 |
| 12 | 9,161.08× | 0.01% | 0% | 0 |
| 13 | 39,301.05× | 0% | 0% | 0 |
| 14 | 233,448.29× | 0% | 0% | 0 |
| 15 | 2,542,251.93× | 0% | 0% | 0 |
Gross return includes stake. Payout caps apply. No profit forecast.
Limited demo observations. No predictions. Independently unaudited.
18+ only. Limit time and spending. Take breaks. Never chase losses.
Outcome generation: independently unverified by us.
Check algorithm, commitments, seeds and nonce.
RTP stated by the developer: 95.5% · Upper payout amount: 20,000 USD · Naira for your personal budget: NGN (₦); USD amounts describe the provider's game limits