Chicken Road
Outcome generation: independently unverified by us.

Game 1 of 2 covered by Chicken Road Wins · InOut Games · 2024
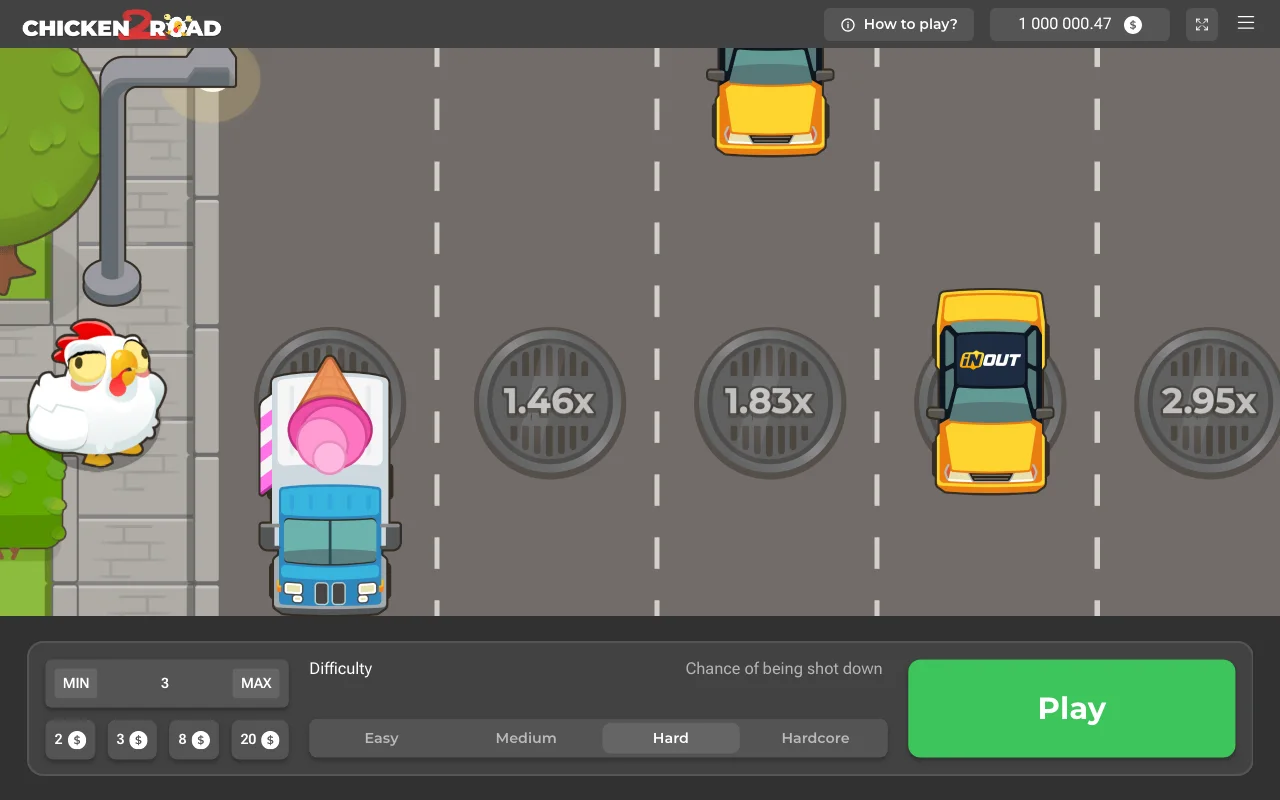
Chicken Road is InOut Games’ step-based gambling title, released on 4 April 2024. You choose a stake and difficulty, begin the round and attempt crossings. A successful step raises the amount you may collect; another attempted step can end the round in a collision. The central decision is therefore when to stop an active round, rather than how quickly to tap the chicken.
Chicken Road Wins research team · How to use our comparisons

Free practice credits. No withdrawals. Adults 18+.
Published return percentage: 98% · Game payout ceiling: 10,000 USD · Currency for your Zambia budget: ZMW (K); InOut stake figures remain in USD
Open the full game reviewThere are four modes: Easy has 24 steps, Medium 22, Hard 20 and Daredevil 15. Their opening multipliers are ×1.03, ×1.12, ×1.23 and ×1.63. The maximum win is USD 10,000. Find the mode selector and stake before starting so those figures belong to the game currently on your screen.
The Easy road finishes at ×19.44, while Medium’s last listed multiplier is ×1,788.80. Hard reaches ×41,321.43 and Daredevil ×2,542,251.93. These are ladder values rather than uncapped amounts of money. Multiplying a large stake by a large final factor can exceed the maximum win, so the cap matters alongside the ladder. Read the operator’s account rules separately. The game’s payout ceiling does not tell you every rule the casino applies when you deposit or withdraw.
After a successful crossing, compare the current collect amount with the stake you put into that round. The multiplier expresses gross return, including the stake. It does not describe profit on top of a returned stake. Collecting ends the round at the accepted amount under the game rules. Trying another crossing risks losing that amount for the chance to collect more after a successful step.
Try the distinction in demo with a small practice stake. Watch the available amount after the opening crossing, collect and then look at the completed balance. Start another practice round and continue instead. You now have a useful comparison of the controls without assuming that either result predicts cash play. Cash-out ends a game round.
The original Easy sequence begins ×1.03, ×1.07, ×1.12 and ×1.17. Medium begins ×1.12, ×1.28, ×1.47 and ×1.70. Those early values let you see the different pace without skipping straight to a dramatic final position. Hard starts ×1.23, ×1.55 and ×1.98; Daredevil starts ×1.63, ×2.80 and ×4.95. A larger possible return reflects a different ladder, not a better personal forecast.
Choose the mode before the round and read its first few positions. A road with fewer steps can still present more demanding choices. The word Easy does not mean the stake is protected, and Daredevil does not unlock a separate source of winning information. If you change the mode after a completed round, check the next stake too. It is easy to focus on the new multiplier and miss that another control still carries the value from your previous attempt.
InOut states 98% RTP for original Chicken Road. The corresponding theoretical house edge is 2%. That relationship describes wagering over the long run. It cannot tell you how much of a deposit you will recover during a particular session. A single round may lose its full stake, and a cash-out can produce a return above it. Both kinds of result fit inside an uncertain game.
Turnover means all the amounts staked, including a return that you collect and stake again. It can grow while the starting deposit stays the same. That is why a theoretical percentage should not become a plan for recovering money spent. Keep the original game’s number attached to the original title. Chicken Road 2 RTP is 95.5% per InOut, and sharing the chicken theme does not give the sequel the same percentage. Use each version’s own rules when comparing their money settings.
The results blocks let you look at actual demo crossings by mode and session dates. Start with the number of included rounds, then read the proportion reaching each step. A rare high multiplier may be interesting, but the context tells you how much of the play it represents. Do not read a best result as a normal outcome or a target that every session should eventually reach.
A stretch of early collisions can happen without creating a debt to the next player. Likewise, several long surviving roads do not use up a future supply of wins. The next random crossing is not explained by a chart shape alone. Our demo history is useful for showing how uneven results can look. It cannot certify a casino, settle a fairness claim or predict a later road. Where a chart category has no available rounds, there is no basis for calculating a personal success rate from it.
A mobile browser can show the game through the casino lobby where access is available. InOut does not supply a standalone Chicken Road app, so a similarly named app is not enough to identify the original. Inside the game, look for the provider name, title and the four mode names before comparing the stake range with this review.
Make room for the bottom controls. If your keyboard covers the stake field, finish typing and check the amount again before starting. If a weak connection leaves the game on an old frame, avoid rapid repeated taps. Reopen the same authenticated account and check the round outcome. The visual animation and the server’s accepted action can become out of sync during a network interruption. A browser refresh is a way to reconnect, rather than an undo button for a settled losing round.
Read the methods shown for your account, any charges, supported currencies and withdrawal requirements. An advertised method can differ by account or region. Ask the casino to clarify a condition before sending money if the answer would change your decision. With the original game review in mind, read the operator’s licence and whether it accepts players from your country. Look for the business behind the website and a support route linked from the account. A game supplier and a casino operator have different roles: InOut makes Chicken Road, while the operator handles your login, identity checks and balance. A larger game maximum does not promise a faster wallet transfer. Keep payment questions with the operator and round-mechanic questions with the game rules, so a delayed withdrawal is not mistaken for a missing in-game collect action.
Chicken Road’s appeal is a visible, repeated choice: collect the return now or attempt one more crossing. The original has a lower minimum stake than the sequel and a shorter Easy road. Those differences can make the controls easier to compare in demo, particularly when you want to understand gross return without adding more on-screen positions. They do not remove the possibility of losing money.
Our practical view is to start with a readable screen, a clear stake currency and an understanding of the USD 10,000 payout ceiling. Treat final multipliers as limits of a ladder rather than goals to force. The review explains the product so you can make an informed choice, including the choice to leave the real-money version alone.
Adults 18+ only. Set time and spending limits while using the original game review; take breaks and never chase losses.
Outcome generation: independently unverified by us.
Check algorithm, commitments, seeds and nonce.
| Crossing position | Return multiplier | Modelled chance of reaching here | Share of demos reaching here | Return including the original stake |
|---|---|---|---|---|
| 1 | 1.03× | 95.15% | 95.47% | 0.983 |
| 2 | 1.07× | 91.59% | 91.13% | 0.975 |
| 3 | 1.12× | 87.5% | 87.73% | 0.983 |
| 4 | 1.17× | 83.76% | 83.07% | 0.972 |
| 5 | 1.23× | 79.67% | 78.4% | 0.964 |
| 6 | 1.29× | 75.97% | 74.13% | 0.956 |
| 7 | 1.36× | 72.06% | 70.27% | 0.956 |
| 8 | 1.44× | 68.06% | 66.67% | 0.96 |
| 9 | 1.53× | 64.05% | 62.47% | 0.956 |
| 10 | 1.63× | 60.12% | 57.33% | 0.935 |
| 11 | 1.75× | 56% | 54.2% | 0.949 |
| 12 | 1.88× | 52.13% | 51.07% | 0.96 |
| 13 | 2.04× | 48.04% | 47.07% | 0.96 |
| 14 | 2.22× | 44.14% | 43.27% | 0.961 |
| 15 | 2.45× | 40% | 39.67% | 0.972 |
| 16 | 2.72× | 36.03% | 35.87% | 0.976 |
| 17 | 3.06× | 32.03% | 32.93% | 1.008 |
| 18 | 3.5× | 28% | 28.87% | 1.01 |
| 19 | 4.08× | 24.02% | 24.6% | 1.004 |
| 20 | 4.9× | 20% | 21% | 1.029 |
| 21 | 6.13× | 15.99% | 16.13% | 0.989 |
| 22 | 6.61× | 14.83% | 12.67% | 0.837 |
| 23 | 9.81× | 9.99% | 9% | 0.883 |
| 24 | 19.44× | 5.04% | 4.87% | 0.946 |
| Crossing position | Return multiplier | Modelled chance of reaching here | Share of demos reaching here | Return including the original stake |
|---|---|---|---|---|
| 1 | 1.12× | 87.5% | 87.8% | 0.983 |
| 2 | 1.28× | 76.56% | 77.27% | 0.989 |
| 3 | 1.47× | 66.67% | 66.8% | 0.982 |
| 4 | 1.7× | 57.65% | 57.13% | 0.971 |
| 5 | 1.98× | 49.49% | 48.53% | 0.961 |
| 6 | 2.33× | 42.06% | 41% | 0.955 |
| 7 | 2.76× | 35.51% | 34.6% | 0.955 |
| 8 | 3.32× | 29.52% | 28.4% | 0.943 |
| 9 | 4.03× | 24.32% | 22.8% | 0.919 |
| 10 | 4.96× | 19.76% | 17.73% | 0.88 |
| 11 | 6.2× | 15.81% | 13.93% | 0.864 |
| 12 | 6.91× | 14.18% | 10.93% | 0.755 |
| 13 | 8.9× | 11.01% | 8.8% | 0.783 |
| 14 | 11.74× | 8.35% | 6.47% | 0.759 |
| 15 | 15.99× | 6.13% | 4.4% | 0.704 |
| 16 | 22.61× | 4.33% | 3.47% | 0.784 |
| 17 | 33.58× | 2.92% | 2.33% | 0.784 |
| 18 | 53.2× | 1.84% | 1.67% | 0.887 |
| 19 | 92.17× | 1.06% | 0.8% | 0.737 |
| 20 | 182.51× | 0.54% | 0.53% | 0.973 |
| 21 | 451.71× | 0.22% | 0.2% | 0.903 |
| 22 | 1,788.8× | 0.05% | 0.07% | 1.193 |
| Crossing position | Return multiplier | Modelled chance of reaching here | Share of demos reaching here | Return including the original stake |
|---|---|---|---|---|
| 1 | 1.23× | 79.67% | 81.67% | 1.005 |
| 2 | 1.55× | 63.23% | 65.87% | 1.021 |
| 3 | 1.98× | 49.49% | 52.8% | 1.045 |
| 4 | 2.56× | 38.28% | 39.6% | 1.014 |
| 5 | 3.36× | 29.17% | 29.4% | 0.988 |
| 6 | 4.49× | 21.83% | 20.8% | 0.934 |
| 7 | 5.49× | 17.85% | 15.87% | 0.871 |
| 8 | 7.53× | 13.01% | 10.4% | 0.783 |
| 9 | 10.56× | 9.28% | 6.27% | 0.662 |
| 10 | 15.21× | 6.44% | 4.6% | 0.7 |
| 11 | 22.59× | 4.34% | 3.2% | 0.723 |
| 12 | 34.79× | 2.82% | 2.07% | 0.719 |
| 13 | 55.97× | 1.75% | 1.53% | 0.858 |
| 14 | 94.99× | 1.03% | 0.73% | 0.697 |
| 15 | 172.42× | 0.57% | 0.4% | 0.69 |
| 16 | 341.4× | 0.29% | 0.27% | 0.91 |
| 17 | 760.46× | 0.13% | 0.07% | 0.507 |
| 18 | 2,007.63× | 0.05% | 0.07% | 1.338 |
| 19 | 6,956.47× | 0.01% | 0% | 0 |
| 20 | 41,321.43× | 0% | 0% | 0 |
| Crossing position | Return multiplier | Modelled chance of reaching here | Share of demos reaching here | Return including the original stake |
|---|---|---|---|---|
| 1 | 1.63× | 60.12% | 59.4% | 0.968 |
| 2 | 2.8× | 35% | 34.4% | 0.963 |
| 3 | 4.95× | 19.8% | 19.4% | 0.96 |
| 4 | 9.08× | 10.79% | 11.6% | 1.053 |
| 5 | 15.21× | 6.44% | 6.53% | 0.994 |
| 6 | 30.12× | 3.25% | 3.8% | 1.145 |
| 7 | 62.96× | 1.56% | 1.73% | 1.091 |
| 8 | 140.24× | 0.7% | 0.87% | 1.215 |
| 9 | 337.19× | 0.29% | 0.33% | 1.124 |
| 10 | 890.19× | 0.11% | 0.13% | 1.187 |
| 11 | 2,643.89× | 0.04% | 0% | 0 |
| 12 | 9,161.08× | 0.01% | 0% | 0 |
| 13 | 39,301.05× | 0% | 0% | 0 |
| 14 | 233,448.29× | 0% | 0% | 0 |
| 15 | 2,542,251.93× | 0% | 0% | 0 |
Gross return includes stake. Payout caps apply. No profit forecast.
Limited demo observations. No predictions. Independently unaudited.
Inside the recorded sample
Fixed starting denominator. Pointwise Wilson intervals. No simultaneous curve coverage.
Demo rounds included: 6,000
Share reaching each successful step
| Game | Road difficulty chosen | Demo rounds included | Step one survival | Uncertainty around that share | Completed roads | Highest multiplier in these rounds |
|---|---|---|---|---|---|---|
| Chicken Road · Easy road | Easy road | 1,500 | 95.47% | 94.29%–96.41% | 73 | 19.44× |
| Chicken Road · Medium road | Medium road | 1,500 | 87.8% | 86.05%–89.36% | 1 | 1,788.8× |
| Chicken Road · Hard road | Hard road | 1,500 | 81.67% | 79.63%–83.54% | 0 | 2,007.63× |
| Chicken Road · Daredevil road | Daredevil road | 1,500 | 59.4% | 56.89%–61.86% | 0 | 890.19× |
Highest successful step, including later losses. No paid prize.
| Crossing position | Successful rounds | Demo rounds included | Share of demos reaching here | Uncertainty around that share |
|---|---|---|---|---|
| 1 | 1,432 | 1,500 | 95.47% | 94.29%–96.41% |
| 2 | 1,367 | 1,500 | 91.13% | 89.59%–92.47% |
| 3 | 1,316 | 1,500 | 87.73% | 85.98%–89.3% |
| 4 | 1,246 | 1,500 | 83.07% | 81.08%–84.88% |
| 5 | 1,176 | 1,500 | 78.4% | 76.25%–80.41% |
| 6 | 1,112 | 1,500 | 74.13% | 71.86%–76.29% |
| 7 | 1,054 | 1,500 | 70.27% | 67.9%–72.53% |
| 8 | 1,000 | 1,500 | 66.67% | 64.24%–69.01% |
| 9 | 937 | 1,500 | 62.47% | 59.99%–64.88% |
| 10 | 860 | 1,500 | 57.33% | 54.81%–59.81% |
| 11 | 813 | 1,500 | 54.2% | 51.67%–56.71% |
| 12 | 766 | 1,500 | 51.07% | 48.54%–53.59% |
| 13 | 706 | 1,500 | 47.07% | 44.55%–49.6% |
| 14 | 649 | 1,500 | 43.27% | 40.78%–45.79% |
| 15 | 595 | 1,500 | 39.67% | 37.22%–42.17% |
| 16 | 538 | 1,500 | 35.87% | 33.48%–38.33% |
| 17 | 494 | 1,500 | 32.93% | 30.6%–35.35% |
| 18 | 433 | 1,500 | 28.87% | 26.63%–31.21% |
| 19 | 369 | 1,500 | 24.6% | 22.49%–26.84% |
| 20 | 315 | 1,500 | 21% | 19.01%–23.13% |
| 21 | 242 | 1,500 | 16.13% | 14.36%–18.08% |
| 22 | 190 | 1,500 | 12.67% | 11.08%–14.45% |
| 23 | 135 | 1,500 | 9% | 7.65%–10.55% |
| 24 | 73 | 1,500 | 4.87% | 3.89%–6.08% |
| Crossing position | Successful rounds | Demo rounds included | Share of demos reaching here | Uncertainty around that share |
|---|---|---|---|---|
| 1 | 1,317 | 1,500 | 87.8% | 86.05%–89.36% |
| 2 | 1,159 | 1,500 | 77.27% | 75.08%–79.32% |
| 3 | 1,002 | 1,500 | 66.8% | 64.38%–69.14% |
| 4 | 857 | 1,500 | 57.13% | 54.61%–59.62% |
| 5 | 728 | 1,500 | 48.53% | 46.01%–51.06% |
| 6 | 615 | 1,500 | 41% | 38.54%–43.51% |
| 7 | 519 | 1,500 | 34.6% | 32.23%–37.04% |
| 8 | 426 | 1,500 | 28.4% | 26.18%–30.73% |
| 9 | 342 | 1,500 | 22.8% | 20.75%–24.99% |
| 10 | 266 | 1,500 | 17.73% | 15.88%–19.75% |
| 11 | 209 | 1,500 | 13.93% | 12.27%–15.78% |
| 12 | 164 | 1,500 | 10.93% | 9.45%–12.61% |
| 13 | 132 | 1,500 | 8.8% | 7.47%–10.34% |
| 14 | 97 | 1,500 | 6.47% | 5.33%–7.83% |
| 15 | 66 | 1,500 | 4.4% | 3.47%–5.56% |
| 16 | 52 | 1,500 | 3.47% | 2.65%–4.52% |
| 17 | 35 | 1,500 | 2.33% | 1.68%–3.23% |
| 18 | 25 | 1,500 | 1.67% | 1.13%–2.45% |
| 19 | 12 | 1,500 | 0.8% | 0.46%–1.39% |
| 20 | 8 | 1,500 | 0.53% | 0.27%–1.05% |
| 21 | 3 | 1,500 | 0.2% | 0.07%–0.59% |
| 22 | 1 | 1,500 | 0.07% | 0.01%–0.38% |
| Crossing position | Successful rounds | Demo rounds included | Share of demos reaching here | Uncertainty around that share |
|---|---|---|---|---|
| 1 | 1,225 | 1,500 | 81.67% | 79.63%–83.54% |
| 2 | 988 | 1,500 | 65.87% | 63.43%–68.22% |
| 3 | 792 | 1,500 | 52.8% | 50.27%–55.32% |
| 4 | 594 | 1,500 | 39.6% | 37.15%–42.1% |
| 5 | 441 | 1,500 | 29.4% | 27.15%–31.76% |
| 6 | 312 | 1,500 | 20.8% | 18.82%–22.93% |
| 7 | 238 | 1,500 | 15.87% | 14.11%–17.8% |
| 8 | 156 | 1,500 | 10.4% | 8.96%–12.05% |
| 9 | 94 | 1,500 | 6.27% | 5.15%–7.61% |
| 10 | 69 | 1,500 | 4.6% | 3.65%–5.78% |
| 11 | 48 | 1,500 | 3.2% | 2.42%–4.22% |
| 12 | 31 | 1,500 | 2.07% | 1.46%–2.92% |
| 13 | 23 | 1,500 | 1.53% | 1.02%–2.29% |
| 14 | 11 | 1,500 | 0.73% | 0.41%–1.31% |
| 15 | 6 | 1,500 | 0.4% | 0.18%–0.87% |
| 16 | 4 | 1,500 | 0.27% | 0.1%–0.68% |
| 17 | 1 | 1,500 | 0.07% | 0.01%–0.38% |
| 18 | 1 | 1,500 | 0.07% | 0.01%–0.38% |
| 19 | 0 | 1,500 | 0% | 0%–0.26% |
| 20 | 0 | 1,500 | 0% | 0%–0.26% |
| Crossing position | Successful rounds | Demo rounds included | Share of demos reaching here | Uncertainty around that share |
|---|---|---|---|---|
| 1 | 891 | 1,500 | 59.4% | 56.89%–61.86% |
| 2 | 516 | 1,500 | 34.4% | 32.04%–36.84% |
| 3 | 291 | 1,500 | 19.4% | 17.48%–21.48% |
| 4 | 174 | 1,500 | 11.6% | 10.08%–13.32% |
| 5 | 98 | 1,500 | 6.53% | 5.39%–7.9% |
| 6 | 57 | 1,500 | 3.8% | 2.94%–4.89% |
| 7 | 26 | 1,500 | 1.73% | 1.19%–2.53% |
| 8 | 13 | 1,500 | 0.87% | 0.51%–1.48% |
| 9 | 5 | 1,500 | 0.33% | 0.14%–0.78% |
| 10 | 2 | 1,500 | 0.13% | 0.04%–0.48% |
| 11 | 0 | 1,500 | 0% | 0%–0.26% |
| 12 | 0 | 1,500 | 0% | 0%–0.26% |
| 13 | 0 | 1,500 | 0% | 0%–0.26% |
| 14 | 0 | 1,500 | 0% | 0%–0.26% |
| 15 | 0 | 1,500 | 0% | 0%–0.26% |
Demo observations. No forecasts. No independent RTP audit.
18+ only. Limit time and spending. Take breaks. Never chase losses.
Published return percentage: 95.5% · Game payout ceiling: 20,000 USD · Currency for your Zambia budget: ZMW (K); InOut stake figures remain in USD
The original has Easy, Medium, Hard and Daredevil roads of 24, 22, 20 and 15 steps. It accepts USD 0.01–150 stakes and has a USD 10,000 maximum win. Check the title before using those amounts.
No. InOut’s 98% RTP is a theoretical long-run return on turnover for original Chicken Road. It does not tell you the result of your deposit or protect an individual round from a full-stake loss.
No. The ladder ends at ×2,542,251.93, but the original game’s maximum win is USD 10,000. A multiplier and a payout ceiling are separate figures that must be read together.
That depends on the operator and your account. Check the balance currency and any conversion in the cashier. The USD stake limits quoted here are provider figures, without an assumed another currency exchange rate.
Chicken Road 2 is InOut’s sequel, with longer roads, USD 0.12–200 stakes and a USD 20,000 maximum win. Its RTP is 95.5% per InOut, so the original’s return percentage cannot be carried across.
No. Earlier collisions do not reveal a favourable next crossing. Raising the stake after losses puts more of your balance into an uncertain round and does not change what a predictor can know.
Model: RTP ÷ multiplier. Independently unverified.
| Crossing position | Share of demos reaching here | Uncertainty around that share | Modelled chance of reaching here |
|---|---|---|---|
| 1 | 95.47% | 94.29% – 96.41% | 95.15% |
| 2 | 91.13% | 89.59% – 92.47% | 91.59% |
| 3 | 87.73% | 85.98% – 89.3% | 87.5% |
| 4 | 83.07% | 81.08% – 84.88% | 83.76% |
| 5 | 78.4% | 76.25% – 80.41% | 79.67% |
| 6 | 74.13% | 71.86% – 76.29% | 75.97% |
| 7 | 70.27% | 67.9% – 72.53% | 72.06% |
| 8 | 66.67% | 64.24% – 69.01% | 68.06% |
| 9 | 62.47% | 59.99% – 64.88% | 64.05% |
| 10 | 57.33% | 54.81% – 59.81% | 60.12% |
| 11 | 54.2% | 51.67% – 56.71% | 56% |
| 12 | 51.07% | 48.54% – 53.59% | 52.13% |
| 13 | 47.07% | 44.55% – 49.6% | 48.04% |
| 14 | 43.27% | 40.78% – 45.79% | 44.14% |
| 15 | 39.67% | 37.22% – 42.17% | 40% |
| 16 | 35.87% | 33.48% – 38.33% | 36.03% |
| 17 | 32.93% | 30.6% – 35.35% | 32.03% |
| 18 | 28.87% | 26.63% – 31.21% | 28% |
| 19 | 24.6% | 22.49% – 26.84% | 24.02% |
| 20 | 21% | 19.01% – 23.13% | 20% |
| 21 | 16.13% | 14.36% – 18.08% | 15.99% |
| 22 | 12.67% | 11.08% – 14.45% | 14.83% |
| 23 | 9% | 7.65% – 10.55% | 9.99% |
| 24 | 4.87% | 3.89% – 6.08% | 5.04% |
| Crossing position | Share of demos reaching here | Uncertainty around that share | Modelled chance of reaching here |
|---|---|---|---|
| 1 | 87.8% | 86.05% – 89.36% | 87.5% |
| 2 | 77.27% | 75.08% – 79.32% | 76.56% |
| 3 | 66.8% | 64.38% – 69.14% | 66.67% |
| 4 | 57.13% | 54.61% – 59.62% | 57.65% |
| 5 | 48.53% | 46.01% – 51.06% | 49.49% |
| 6 | 41% | 38.54% – 43.51% | 42.06% |
| 7 | 34.6% | 32.23% – 37.04% | 35.51% |
| 8 | 28.4% | 26.18% – 30.73% | 29.52% |
| 9 | 22.8% | 20.75% – 24.99% | 24.32% |
| 10 | 17.73% | 15.88% – 19.75% | 19.76% |
| 11 | 13.93% | 12.27% – 15.78% | 15.81% |
| 12 | 10.93% | 9.45% – 12.61% | 14.18% |
| 13 | 8.8% | 7.47% – 10.34% | 11.01% |
| 14 | 6.47% | 5.33% – 7.83% | 8.35% |
| 15 | 4.4% | 3.47% – 5.56% | 6.13% |
| 16 | 3.47% | 2.65% – 4.52% | 4.33% |
| 17 | 2.33% | 1.68% – 3.23% | 2.92% |
| 18 | 1.67% | 1.13% – 2.45% | 1.84% |
| 19 | 0.8% | 0.46% – 1.39% | 1.06% |
| 20 | 0.53% | 0.27% – 1.05% | 0.54% |
| 21 | 0.2% | 0.07% – 0.59% | 0.22% |
| 22 | 0.07% | 0.01% – 0.38% | 0.05% |
| Crossing position | Share of demos reaching here | Uncertainty around that share | Modelled chance of reaching here |
|---|---|---|---|
| 1 | 81.67% | 79.63% – 83.54% | 79.67% |
| 2 | 65.87% | 63.43% – 68.22% | 63.23% |
| 3 | 52.8% | 50.27% – 55.32% | 49.49% |
| 4 | 39.6% | 37.15% – 42.1% | 38.28% |
| 5 | 29.4% | 27.15% – 31.76% | 29.17% |
| 6 | 20.8% | 18.82% – 22.93% | 21.83% |
| 7 | 15.87% | 14.11% – 17.8% | 17.85% |
| 8 | 10.4% | 8.96% – 12.05% | 13.01% |
| 9 | 6.27% | 5.15% – 7.61% | 9.28% |
| 10 | 4.6% | 3.65% – 5.78% | 6.44% |
| 11 | 3.2% | 2.42% – 4.22% | 4.34% |
| 12 | 2.07% | 1.46% – 2.92% | 2.82% |
| 13 | 1.53% | 1.02% – 2.29% | 1.75% |
| 14 | 0.73% | 0.41% – 1.31% | 1.03% |
| 15 | 0.4% | 0.18% – 0.87% | 0.57% |
| 16 | 0.27% | 0.1% – 0.68% | 0.29% |
| 17 | 0.07% | 0.01% – 0.38% | 0.13% |
| 18 | 0.07% | 0.01% – 0.38% | 0.05% |
| 19 | 0% | 0% – 0.26% | 0.01% |
| 20 | 0% | 0% – 0.26% | 0% |
| Crossing position | Share of demos reaching here | Uncertainty around that share | Modelled chance of reaching here |
|---|---|---|---|
| 1 | 59.4% | 56.89% – 61.86% | 60.12% |
| 2 | 34.4% | 32.04% – 36.84% | 35% |
| 3 | 19.4% | 17.48% – 21.48% | 19.8% |
| 4 | 11.6% | 10.08% – 13.32% | 10.79% |
| 5 | 6.53% | 5.39% – 7.9% | 6.44% |
| 6 | 3.8% | 2.94% – 4.89% | 3.25% |
| 7 | 1.73% | 1.19% – 2.53% | 1.56% |
| 8 | 0.87% | 0.51% – 1.48% | 0.7% |
| 9 | 0.33% | 0.14% – 0.78% | 0.29% |
| 10 | 0.13% | 0.04% – 0.48% | 0.11% |
| 11 | 0% | 0% – 0.26% | 0.04% |
| 12 | 0% | 0% – 0.26% | 0.01% |
| 13 | 0% | 0% – 0.26% | 0% |
| 14 | 0% | 0% – 0.26% | 0% |
| 15 | 0% | 0% – 0.26% | 0% |
Chicken Road