Chicken Road 2
Share reaching each successful step
Easy roadMedium roadHard roadDaredevil road
Game 2 of 2 covered by Chicken Road Wins · InOut Games · 2025
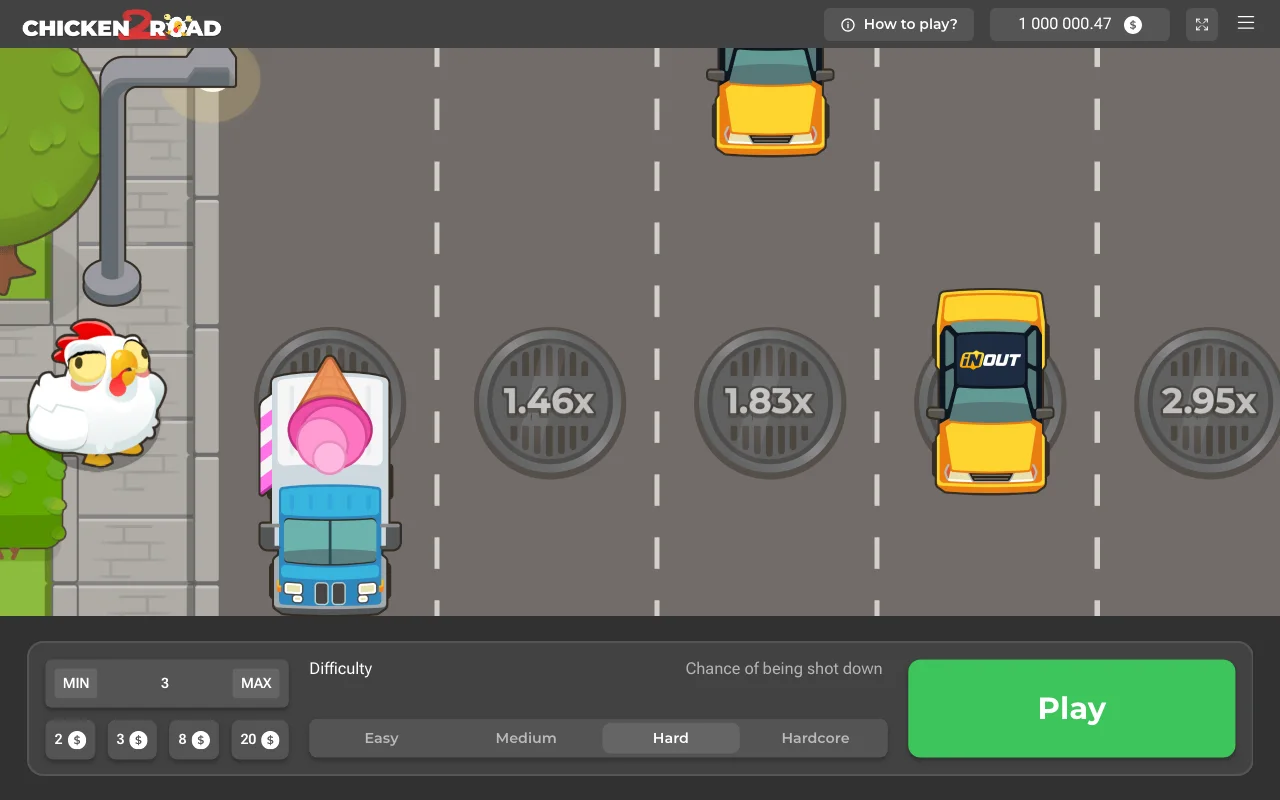
Chicken Road 2 is the second InOut Games crossing title covered by Chicken Road Wins. You commit a stake, choose a road difficulty and decide after a successful crossing whether to collect or continue. The chicken animation makes that choice easy to follow, while the amount attached to the collect control tells you what the current round can return. A collision can end it with the stake lost.
Chicken Road Wins research team · How to use our comparisons
Free practice credits. No withdrawals. Adults 18+.
Published return percentage: 95.5% · Game payout ceiling: 20,000 USD · Currency for your Zambia budget: ZMW (K); InOut stake figures remain in USD
Open the full game reviewInOut released the sequel on 15 April 2025.
The headline change is room for more crossing positions. Easy now has 30 steps, Medium 25, Hard 22 and Daredevil 18. That gives each ladder its own progression rather than simply changing the artwork. For a reader budgeting in your account currency, the other immediate difference is the provider’s USD 0.12 minimum stake. Keep the USD figure intact when checking the actual account cost in your account currency; do not treat a K balance label as permission to substitute currencies.
With the sequel review in mind, Chicken Road 2 RTP is 95.5% per InOut. We therefore use 95.5%, giving a 4.5% long-run house edge, rather than the original’s figure. The sequel’s maximum win, opening multipliers and step totals do not verify the published RTP by themselves. They describe possible amounts and positions, without stating the probability of every result needed to calculate a theoretical return.
This matters when a comparison page or social post gives both games one shared percentage. Look at the exact product named beside that number. A shared maker and similar controls do not make the underlying return figure transferable. A handful of demo results cannot calculate the sequel’s theoretical house edge either. You can still compare stake range, payout cap and road lengths, but the lower RTP is a real limit on a full mathematical comparison. Keep it visible rather than turning an attractive multiplier into a substitute.
The game stake range is USD 0.12–200 and the maximum win is USD 20,000. A casino deposit is separate from a round stake: the cashier may apply its own supported currencies, payment minimums, charges and account rules. You need both sets of amounts to understand the cost. A payment method’s minimum transfer does not change the game’s listed minimum bet. Find the methods actually available to your account, including their withdrawal use, before deciding whether the service fits your needs. The payment logo alone does not say what currency your game will use. Read any conversion display at the point where you commit money. To compare USD game limits with your personal budget, read your chosen service’s exchange rate and charges. Chicken Road Wins does not assume a fixed conversion.
The Easy ladder opens at ×1.01, then ×1.03, ×1.06 and ×1.10. Its final listed multiplier is ×23.24. Medium begins ×1.08 and has 25 positions, reaching ×2,457 at the end. Those values help you recognise the sequel and see why a longer road may initially feel gradual. Each new attempted crossing still exposes the active round to a losing result.
Hard starts at ×1.18, then ×1.46 and ×1.83, with 22 positions ending at ×62,162.09. Daredevil begins ×1.44, ×2.21 and ×3.45; its 18th position lists ×3,608,855.25. Read those final factors alongside the USD 20,000 payout cap. A large multiplication does not create an uncapped claim against the casino. The ladder describes how a surviving round develops, rather than how often you can expect to reach its far end. Choose based on a clear understanding of the road, not a final number alone.
A successful crossing leaves you with a choice about the amount currently available. Collecting accepts that ending under the game’s rules; pressing for another step attempts a larger return while leaving the current one unsettled. The next multiplier can be tempting because it is visible, but visibility is different from possession. It has no cash value for your account until the required result and settlement occur.
Keep gross return and profit distinct. The multiplier applies to the stake, and the resulting amount includes that stake. If the game displays a potential collect amount, use that actual amount rather than trying to remember a factor from another difficulty. After the round ends, check the settled balance before starting again. A quick new tap can make separate rounds feel like one continuous event, even though each new stake is a fresh commitment. Slowing down the decision makes the money movement easier to understand.
Use the demo to locate each control and try collecting before you explore the later steps. Switch between Easy and Medium only after the current round has ended. Notice how the first multiplier and the road length change together. Then compare Hard or Daredevil with the same practice stake. Keeping the stake steady makes the mode difference easier to see without introducing another variable into your reading.
A practice balance is not an offer of cash. It cannot become a payment to your mobile wallet, and a reset does not repay a real loss. The purpose is familiarity: how the selected mode is marked, where the current return appears and how the game shows a completed round. A few long demo roads cannot tell you how a future cash session will finish. Treat an interruption as another control question: can you reconnect and find the settled round, rather than assume an old animation is still current?
Our results blocks are grouped by the edition and difficulty named on them. Check the dates and included round count before looking at the best multiplier or the share of crossings that reached a position. A high point from one short run can look striking without representing the usual spread of outcomes. Different road lengths also make final-position comparisons misleading if you ignore the selected mode.
The blocks do not verify published RTP, predict a collision or prove that a cash operator handles withdrawals well. Those are separate questions requiring different information. Where no demo history is available, there is nothing to extrapolate from that blank. If a result chart has a long losing stretch, the next crossing still does not owe a correction. If it has a long winning stretch, the next player has no claim to continue it. Random results can make shapes that look more meaningful than they are.
With the sequel review in mind, inOut does not provide a standalone Chicken Road app. A phone package labelled Chicken Road 2 can be a third-party title, and a chicken picture says little about who made it. Open the game information panel through the casino browser lobby and read the InOut Games name along with the title. Match the sequel’s limits and mode lengths instead of relying on a familiar icon.
Arrange the browser so the stake field, road selector and collect amount remain readable. If a payment notification or keyboard covers them, clear the obstruction before a round. A weak connection is a reason to pause new actions and check the completed result in the same account. Repeatedly reopening different links can make it harder to know which session you are seeing. No mobile installation can make a random crossing certain or replace the operator’s account support when the balance needs an explanation.
A genuine InOut game and a suitable casino account are two different checks. Find the company running the casino and read its licence details. Check how to reach support and which countries it accepts. With the sequel review in mind, read the operator’s licence and whether it accepts players from your country. That check comes before entering personal documents or arranging a payment.
Read the withdrawal process as well as the deposit screen. Look for verification requirements, available balance types and any bonus condition that affects moving money out. Cash-out inside Chicken Road 2 settles a round; it does not automatically send money to Airtel Money or MTN MoMo. If a transfer status is unclear, use the operator’s authenticated support channel and the request reference. The game’s maximum win cannot tell you how to withdraw from that casino account. A fast chicken animation says nothing about how long a withdrawal takes.
The sequel offers longer roads, a higher stake ceiling and a larger maximum win than the original. Its slower-opening Easy ladder may suit a demo comparison where you want to watch more positions unfold. With both RTP figures published, the original’s 98% returns more over the long run than the sequel’s 95.5%. Its higher minimum also means a first stake costs more in provider USD. Those points are more useful than calling the newer title automatically better.
Start by deciding whether you understand the amount at risk in the account’s currency. Then choose a mode and practise the collect control before deciding whether cash play fits your circumstances. Money already needed for a household budget has another job before it reaches any casino balance. A bright final multiplier cannot change that. Compare the current stake, possible gross return and game cap together. That gives you more to work with than the largest multiplier alone when deciding whether to continue.
Adults 18+ only. Set time and spending limits while using the sequel review; take breaks and never chase losses.
Inside the recorded sample
Fixed starting denominator. Pointwise Wilson intervals. No simultaneous curve coverage.
Demo rounds included: 6,000
Share reaching each successful step
| Game | Road difficulty chosen | Demo rounds included | Step one survival | Uncertainty around that share | Completed roads | Highest multiplier in these rounds |
|---|---|---|---|---|---|---|
| Chicken Road 2 · Easy road | Easy road | 1,500 | 96.2% | 95.11%–97.06% | 55 | 23.24× |
| Chicken Road 2 · Medium road | Medium road | 1,500 | 89.67% | 88.02%–91.11% | 0 | 638.82× |
| Chicken Road 2 · Hard road | Hard road | 1,500 | 81.67% | 79.63%–83.54% | 0 | 1,283.03× |
| Chicken Road 2 · Daredevil road | Daredevil road | 1,500 | 67.73% | 65.32%–70.05% | 0 | 2,235.72× |
Highest successful step, including later losses. No paid prize.
| Crossing position | Successful rounds | Demo rounds included | Share of demos reaching here | Uncertainty around that share |
|---|---|---|---|---|
| 1 | 1,443 | 1,500 | 96.2% | 95.11%–97.06% |
| 2 | 1,409 | 1,500 | 93.93% | 92.61%–95.03% |
| 3 | 1,358 | 1,500 | 90.53% | 88.95%–91.91% |
| 4 | 1,309 | 1,500 | 87.27% | 85.48%–88.86% |
| 5 | 1,247 | 1,500 | 83.13% | 81.15%–84.94% |
| 6 | 1,202 | 1,500 | 80.13% | 78.04%–82.07% |
| 7 | 1,148 | 1,500 | 76.53% | 74.32%–78.61% |
| 8 | 1,103 | 1,500 | 73.53% | 71.24%–75.7% |
| 9 | 1,059 | 1,500 | 70.6% | 68.24%–72.85% |
| 10 | 1,001 | 1,500 | 66.73% | 64.31%–69.07% |
| 11 | 955 | 1,500 | 63.67% | 61.2%–66.06% |
| 12 | 910 | 1,500 | 60.67% | 58.17%–63.11% |
| 13 | 858 | 1,500 | 57.2% | 54.68%–59.68% |
| 14 | 813 | 1,500 | 54.2% | 51.67%–56.71% |
| 15 | 768 | 1,500 | 51.2% | 48.67%–53.72% |
| 16 | 722 | 1,500 | 48.13% | 45.61%–50.66% |
| 17 | 680 | 1,500 | 45.33% | 42.83%–47.86% |
| 18 | 640 | 1,500 | 42.67% | 40.19%–45.19% |
| 19 | 593 | 1,500 | 39.53% | 37.09%–42.03% |
| 20 | 547 | 1,500 | 36.47% | 34.07%–38.93% |
| 21 | 495 | 1,500 | 33% | 30.67%–35.42% |
| 22 | 452 | 1,500 | 30.13% | 27.86%–32.5% |
| 23 | 395 | 1,500 | 26.33% | 24.17%–28.62% |
| 24 | 347 | 1,500 | 23.13% | 21.07%–25.33% |
| 25 | 300 | 1,500 | 20% | 18.05%–22.1% |
| 26 | 245 | 1,500 | 16.33% | 14.55%–18.29% |
| 27 | 196 | 1,500 | 13.07% | 11.45%–14.87% |
| 28 | 152 | 1,500 | 10.13% | 8.71%–11.76% |
| 29 | 107 | 1,500 | 7.13% | 5.94%–8.55% |
| 30 | 55 | 1,500 | 3.67% | 2.83%–4.74% |
| Crossing position | Successful rounds | Demo rounds included | Share of demos reaching here | Uncertainty around that share |
|---|---|---|---|---|
| 1 | 1,345 | 1,500 | 89.67% | 88.02%–91.11% |
| 2 | 1,179 | 1,500 | 78.6% | 76.45%–80.6% |
| 3 | 1,053 | 1,500 | 70.2% | 67.84%–72.46% |
| 4 | 926 | 1,500 | 61.73% | 59.25%–64.16% |
| 5 | 807 | 1,500 | 53.8% | 51.27%–56.31% |
| 6 | 705 | 1,500 | 47% | 44.49%–49.53% |
| 7 | 621 | 1,500 | 41.4% | 38.93%–43.91% |
| 8 | 543 | 1,500 | 36.2% | 33.81%–38.66% |
| 9 | 461 | 1,500 | 30.73% | 28.45%–33.11% |
| 10 | 380 | 1,500 | 25.33% | 23.2%–27.6% |
| 11 | 321 | 1,500 | 21.4% | 19.4%–23.55% |
| 12 | 264 | 1,500 | 17.6% | 15.76%–19.61% |
| 13 | 210 | 1,500 | 14% | 12.34%–15.85% |
| 14 | 172 | 1,500 | 11.47% | 9.95%–13.18% |
| 15 | 134 | 1,500 | 8.93% | 7.59%–10.48% |
| 16 | 94 | 1,500 | 6.27% | 5.15%–7.61% |
| 17 | 76 | 1,500 | 5.07% | 4.07%–6.3% |
| 18 | 54 | 1,500 | 3.6% | 2.77%–4.67% |
| 19 | 42 | 1,500 | 2.8% | 2.08%–3.76% |
| 20 | 31 | 1,500 | 2.07% | 1.46%–2.92% |
| 21 | 18 | 1,500 | 1.2% | 0.76%–1.89% |
| 22 | 7 | 1,500 | 0.47% | 0.23%–0.96% |
| 23 | 4 | 1,500 | 0.27% | 0.1%–0.68% |
| 24 | 1 | 1,500 | 0.07% | 0.01%–0.38% |
| 25 | 0 | 1,500 | 0% | 0%–0.26% |
| Crossing position | Successful rounds | Demo rounds included | Share of demos reaching here | Uncertainty around that share |
|---|---|---|---|---|
| 1 | 1,225 | 1,500 | 81.67% | 79.63%–83.54% |
| 2 | 970 | 1,500 | 64.67% | 62.21%–67.05% |
| 3 | 780 | 1,500 | 52% | 49.47%–54.52% |
| 4 | 616 | 1,500 | 41.07% | 38.6%–43.58% |
| 5 | 468 | 1,500 | 31.2% | 28.91%–33.59% |
| 6 | 355 | 1,500 | 23.67% | 21.58%–25.88% |
| 7 | 258 | 1,500 | 17.2% | 15.37%–19.19% |
| 8 | 196 | 1,500 | 13.07% | 11.45%–14.87% |
| 9 | 142 | 1,500 | 9.47% | 8.09%–11.05% |
| 10 | 96 | 1,500 | 6.4% | 5.27%–7.75% |
| 11 | 70 | 1,500 | 4.67% | 3.71%–5.85% |
| 12 | 51 | 1,500 | 3.4% | 2.6%–4.44% |
| 13 | 29 | 1,500 | 1.93% | 1.35%–2.76% |
| 14 | 17 | 1,500 | 1.13% | 0.71%–1.81% |
| 15 | 8 | 1,500 | 0.53% | 0.27%–1.05% |
| 16 | 5 | 1,500 | 0.33% | 0.14%–0.78% |
| 17 | 2 | 1,500 | 0.13% | 0.04%–0.48% |
| 18 | 2 | 1,500 | 0.13% | 0.04%–0.48% |
| 19 | 1 | 1,500 | 0.07% | 0.01%–0.38% |
| 20 | 0 | 1,500 | 0% | 0%–0.26% |
| 21 | 0 | 1,500 | 0% | 0%–0.26% |
| 22 | 0 | 1,500 | 0% | 0%–0.26% |
| Crossing position | Successful rounds | Demo rounds included | Share of demos reaching here | Uncertainty around that share |
|---|---|---|---|---|
| 1 | 1,016 | 1,500 | 67.73% | 65.32%–70.05% |
| 2 | 646 | 1,500 | 43.07% | 40.58%–45.59% |
| 3 | 426 | 1,500 | 28.4% | 26.18%–30.73% |
| 4 | 271 | 1,500 | 18.07% | 16.2%–20.09% |
| 5 | 161 | 1,500 | 10.73% | 9.27%–12.4% |
| 6 | 92 | 1,500 | 6.13% | 5.03%–7.46% |
| 7 | 56 | 1,500 | 3.73% | 2.89%–4.82% |
| 8 | 34 | 1,500 | 2.27% | 1.63%–3.15% |
| 9 | 17 | 1,500 | 1.13% | 0.71%–1.81% |
| 10 | 9 | 1,500 | 0.6% | 0.32%–1.14% |
| 11 | 5 | 1,500 | 0.33% | 0.14%–0.78% |
| 12 | 2 | 1,500 | 0.13% | 0.04%–0.48% |
| 13 | 1 | 1,500 | 0.07% | 0.01%–0.38% |
| 14 | 0 | 1,500 | 0% | 0%–0.26% |
| 15 | 0 | 1,500 | 0% | 0%–0.26% |
| 16 | 0 | 1,500 | 0% | 0%–0.26% |
| 17 | 0 | 1,500 | 0% | 0%–0.26% |
| 18 | 0 | 1,500 | 0% | 0%–0.26% |
Demo observations. No forecasts. No independent RTP audit.
Its provider minimum is USD 0.12, with a USD 200 upper game stake. Check the account currency and conversion when comparing that amount with another currency. A cashier’s own minimum deposit is a separate requirement.
Easy has 30, Medium 25, Hard 22 and Daredevil 18. These totals describe the complete roads. A round can end before the last position, and reaching an earlier crossing gives no promise about the next one.
Treat it as a long-run game figure, without expecting a fixed share back from the session you open.
No. ×3,608,855.25 is the final listed ladder multiplier, while USD 20,000 remains the game maximum win. Read the displayed payout and the rules together when a stake multiplied by a factor would exceed that ceiling.
A real-money Chicken Road 2 round can produce a payable return or lose its stake. Demo credits cannot be withdrawn or turned into an MTN MoMo or Airtel Money transfer. Any available cash balance remains subject to the casino’s verification and withdrawal conditions.
There is no single answer based on location alone. Compare the smallest stake, road length, payout ceiling and information available about the game, then check the operator’s account and access terms for your own circumstances.
18+ only. Limit time and spending. Take breaks. Never chase losses.
Outcome generation: independently unverified by us.
Check algorithm, commitments, seeds and nonce.
Chicken Road 2

Published return percentage: 98% · Game payout ceiling: 10,000 USD · Currency for your Zambia budget: ZMW (K); InOut stake figures remain in USD
Model: RTP ÷ multiplier. Independently unverified.
| Crossing position | Share of demos reaching here | Uncertainty around that share | Modelled chance of reaching here |
|---|---|---|---|
| 1 | 96.2% | 95.11% – 97.06% | 94.55% |
| 2 | 93.93% | 92.61% – 95.03% | 92.72% |
| 3 | 90.53% | 88.95% – 91.91% | 90.09% |
| 4 | 87.27% | 85.48% – 88.86% | 86.82% |
| 5 | 83.13% | 81.15% – 84.94% | 83.04% |
| 6 | 80.13% | 78.04% – 82.07% | 80.25% |
| 7 | 76.53% | 74.32% – 78.61% | 77.02% |
| 8 | 73.53% | 71.24% – 75.7% | 73.46% |
| 9 | 70.6% | 68.24% – 72.85% | 70.74% |
| 10 | 66.73% | 64.31% – 69.07% | 67.25% |
| 11 | 63.67% | 61.2% – 66.06% | 64.53% |
| 12 | 60.67% | 58.17% – 63.11% | 61.22% |
| 13 | 57.2% | 54.68% – 59.68% | 57.88% |
| 14 | 54.2% | 51.67% – 56.71% | 54.57% |
| 15 | 51.2% | 48.67% – 53.72% | 51.62% |
| 16 | 48.13% | 45.61% – 50.66% | 48.23% |
| 17 | 45.33% | 42.83% – 47.86% | 45.05% |
| 18 | 42.67% | 40.19% – 45.19% | 41.89% |
| 19 | 39.53% | 37.09% – 42.03% | 38.66% |
| 20 | 36.47% | 34.07% – 38.93% | 35.37% |
| 21 | 33% | 30.67% – 35.42% | 32.26% |
| 22 | 30.13% | 27.86% – 32.5% | 29.12% |
| 23 | 26.33% | 24.17% – 28.62% | 25.81% |
| 24 | 23.13% | 21.07% – 25.33% | 23.24% |
| 25 | 20% | 18.05% – 22.1% | 20.58% |
| 26 | 16.33% | 14.55% – 18.29% | 17.72% |
| 27 | 13.07% | 11.45% – 14.87% | 14.69% |
| 28 | 10.13% | 8.71% – 11.76% | 11.42% |
| 29 | 7.13% | 5.94% – 8.55% | 7.91% |
| 30 | 3.67% | 2.83% – 4.74% | 4.11% |
| Crossing position | Share of demos reaching here | Uncertainty around that share | Modelled chance of reaching here |
|---|---|---|---|
| 1 | 89.67% | 88.02% – 91.11% | 88.43% |
| 2 | 78.6% | 76.45% – 80.6% | 78.93% |
| 3 | 70.2% | 67.84% – 72.46% | 69.71% |
| 4 | 61.73% | 59.25% – 64.16% | 61.22% |
| 5 | 53.8% | 51.27% – 56.31% | 53.65% |
| 6 | 47% | 44.49% – 49.53% | 46.59% |
| 7 | 41.4% | 38.93% – 43.91% | 40.3% |
| 8 | 36.2% | 33.81% – 38.66% | 34.48% |
| 9 | 30.73% | 28.45% – 33.11% | 29.48% |
| 10 | 25.33% | 23.2% – 27.6% | 24.81% |
| 11 | 21.4% | 19.4% – 23.55% | 20.67% |
| 12 | 17.6% | 15.76% – 19.61% | 17.02% |
| 13 | 14% | 12.34% – 15.85% | 13.82% |
| 14 | 11.47% | 9.95% – 13.18% | 11.05% |
| 15 | 8.93% | 7.59% – 10.48% | 8.69% |
| 16 | 6.27% | 5.15% – 7.61% | 6.68% |
| 17 | 5.07% | 4.07% – 6.3% | 5.04% |
| 18 | 3.6% | 2.77% – 4.67% | 3.66% |
| 19 | 2.8% | 2.08% – 3.76% | 2.56% |
| 20 | 2.07% | 1.46% – 2.92% | 1.77% |
| 21 | 1.2% | 0.76% – 1.89% | 1.16% |
| 22 | 0.47% | 0.23% – 0.96% | 0.69% |
| 23 | 0.27% | 0.1% – 0.68% | 0.36% |
| 24 | 0.07% | 0.01% – 0.38% | 0.15% |
| 25 | 0% | 0% – 0.26% | 0.04% |
| Crossing position | Share of demos reaching here | Uncertainty around that share | Modelled chance of reaching here |
|---|---|---|---|
| 1 | 81.67% | 79.63% – 83.54% | 80.93% |
| 2 | 64.67% | 62.21% – 67.05% | 65.41% |
| 3 | 52% | 49.47% – 54.52% | 52.19% |
| 4 | 41.07% | 38.6% – 43.58% | 41.34% |
| 5 | 31.2% | 28.91% – 33.59% | 32.37% |
| 6 | 23.67% | 21.58% – 25.88% | 25% |
| 7 | 17.2% | 15.37% – 19.19% | 19.02% |
| 8 | 13.07% | 11.45% – 14.87% | 14.34% |
| 9 | 9.47% | 8.09% – 11.05% | 10.56% |
| 10 | 6.4% | 5.27% – 7.75% | 7.63% |
| 11 | 4.67% | 3.71% – 5.85% | 5.38% |
| 12 | 3.4% | 2.6% – 4.44% | 3.7% |
| 13 | 1.93% | 1.35% – 2.76% | 2.47% |
| 14 | 1.13% | 0.71% – 1.81% | 1.59% |
| 15 | 0.53% | 0.27% – 1.05% | 0.98% |
| 16 | 0.33% | 0.14% – 0.78% | 0.57% |
| 17 | 0.13% | 0.04% – 0.48% | 0.31% |
| 18 | 0.13% | 0.04% – 0.48% | 0.16% |
| 19 | 0.07% | 0.01% – 0.38% | 0.07% |
| 20 | 0% | 0% – 0.26% | 0.03% |
| 21 | 0% | 0% – 0.26% | 0.01% |
| 22 | 0% | 0% – 0.26% | 0% |
| Crossing position | Share of demos reaching here | Uncertainty around that share | Modelled chance of reaching here |
|---|---|---|---|
| 1 | 67.73% | 65.32% – 70.05% | 66.32% |
| 2 | 43.07% | 40.58% – 45.59% | 43.21% |
| 3 | 28.4% | 26.18% – 30.73% | 27.68% |
| 4 | 18.07% | 16.2% – 20.09% | 17.27% |
| 5 | 10.73% | 9.27% – 12.4% | 10.51% |
| 6 | 6.13% | 5.03% – 7.46% | 6.24% |
| 7 | 3.73% | 2.89% – 4.82% | 3.57% |
| 8 | 2.27% | 1.63% – 3.15% | 1.96% |
| 9 | 1.13% | 0.71% – 1.81% | 1.03% |
| 10 | 0.6% | 0.32% – 1.14% | 0.52% |
| 11 | 0.33% | 0.14% – 0.78% | 0.24% |
| 12 | 0.13% | 0.04% – 0.48% | 0.11% |
| 13 | 0.07% | 0.01% – 0.38% | 0.04% |
| 14 | 0% | 0% – 0.26% | 0.02% |
| 15 | 0% | 0% – 0.26% | 0.01% |
| 16 | 0% | 0% – 0.26% | 0% |
| 17 | 0% | 0% – 0.26% | 0% |
| 18 | 0% | 0% – 0.26% | 0% |
| Crossing position | Return multiplier | Modelled chance of reaching here | Share of demos reaching here | Return including the original stake |
|---|---|---|---|---|
| 1 | 1.01× | 94.55% | 96.2% | 0.972 |
| 2 | 1.03× | 92.72% | 93.93% | 0.968 |
| 3 | 1.06× | 90.09% | 90.53% | 0.96 |
| 4 | 1.1× | 86.82% | 87.27% | 0.96 |
| 5 | 1.15× | 83.04% | 83.13% | 0.956 |
| 6 | 1.19× | 80.25% | 80.13% | 0.954 |
| 7 | 1.24× | 77.02% | 76.53% | 0.949 |
| 8 | 1.3× | 73.46% | 73.53% | 0.956 |
| 9 | 1.35× | 70.74% | 70.6% | 0.953 |
| 10 | 1.42× | 67.25% | 66.73% | 0.948 |
| 11 | 1.48× | 64.53% | 63.67% | 0.942 |
| 12 | 1.56× | 61.22% | 60.67% | 0.946 |
| 13 | 1.65× | 57.88% | 57.2% | 0.944 |
| 14 | 1.75× | 54.57% | 54.2% | 0.949 |
| 15 | 1.85× | 51.62% | 51.2% | 0.947 |
| 16 | 1.98× | 48.23% | 48.13% | 0.953 |
| 17 | 2.12× | 45.05% | 45.33% | 0.961 |
| 18 | 2.28× | 41.89% | 42.67% | 0.973 |
| 19 | 2.47× | 38.66% | 39.53% | 0.976 |
| 20 | 2.7× | 35.37% | 36.47% | 0.985 |
| 21 | 2.96× | 32.26% | 33% | 0.977 |
| 22 | 3.28× | 29.12% | 30.13% | 0.988 |
| 23 | 3.7× | 25.81% | 26.33% | 0.974 |
| 24 | 4.11× | 23.24% | 23.13% | 0.951 |
| 25 | 4.64× | 20.58% | 20% | 0.928 |
| 26 | 5.39× | 17.72% | 16.33% | 0.88 |
| 27 | 6.5× | 14.69% | 13.07% | 0.849 |
| 28 | 8.36× | 11.42% | 10.13% | 0.847 |
| 29 | 12.08× | 7.91% | 7.13% | 0.862 |
| 30 | 23.24× | 4.11% | 3.67% | 0.852 |
| Crossing position | Return multiplier | Modelled chance of reaching here | Share of demos reaching here | Return including the original stake |
|---|---|---|---|---|
| 1 | 1.08× | 88.43% | 89.67% | 0.968 |
| 2 | 1.21× | 78.93% | 78.6% | 0.951 |
| 3 | 1.37× | 69.71% | 70.2% | 0.962 |
| 4 | 1.56× | 61.22% | 61.73% | 0.963 |
| 5 | 1.78× | 53.65% | 53.8% | 0.958 |
| 6 | 2.05× | 46.59% | 47% | 0.963 |
| 7 | 2.37× | 40.3% | 41.4% | 0.981 |
| 8 | 2.77× | 34.48% | 36.2% | 1.003 |
| 9 | 3.24× | 29.48% | 30.73% | 0.996 |
| 10 | 3.85× | 24.81% | 25.33% | 0.975 |
| 11 | 4.62× | 20.67% | 21.4% | 0.989 |
| 12 | 5.61× | 17.02% | 17.6% | 0.987 |
| 13 | 6.91× | 13.82% | 14% | 0.967 |
| 14 | 8.64× | 11.05% | 11.47% | 0.991 |
| 15 | 10.99× | 8.69% | 8.93% | 0.982 |
| 16 | 14.29× | 6.68% | 6.27% | 0.896 |
| 17 | 18.96× | 5.04% | 5.07% | 0.961 |
| 18 | 26.07× | 3.66% | 3.6% | 0.939 |
| 19 | 37.24× | 2.56% | 2.8% | 1.043 |
| 20 | 53.82× | 1.77% | 2.07% | 1.112 |
| 21 | 82.36× | 1.16% | 1.2% | 0.988 |
| 22 | 137.59× | 0.69% | 0.47% | 0.642 |
| 23 | 265.35× | 0.36% | 0.27% | 0.708 |
| 24 | 638.82× | 0.15% | 0.07% | 0.426 |
| 25 | 2,457× | 0.04% | 0% | 0 |
| Crossing position | Return multiplier | Modelled chance of reaching here | Share of demos reaching here | Return including the original stake |
|---|---|---|---|---|
| 1 | 1.18× | 80.93% | 81.67% | 0.964 |
| 2 | 1.46× | 65.41% | 64.67% | 0.944 |
| 3 | 1.83× | 52.19% | 52% | 0.952 |
| 4 | 2.31× | 41.34% | 41.07% | 0.949 |
| 5 | 2.95× | 32.37% | 31.2% | 0.92 |
| 6 | 3.82× | 25% | 23.67% | 0.904 |
| 7 | 5.02× | 19.02% | 17.2% | 0.863 |
| 8 | 6.66× | 14.34% | 13.07% | 0.87 |
| 9 | 9.04× | 10.56% | 9.47% | 0.856 |
| 10 | 12.52× | 7.63% | 6.4% | 0.801 |
| 11 | 17.74× | 5.38% | 4.67% | 0.828 |
| 12 | 25.8× | 3.7% | 3.4% | 0.877 |
| 13 | 38.71× | 2.47% | 1.93% | 0.748 |
| 14 | 60.21× | 1.59% | 1.13% | 0.682 |
| 15 | 97.34× | 0.98% | 0.53% | 0.519 |
| 16 | 166.87× | 0.57% | 0.33% | 0.556 |
| 17 | 305.94× | 0.31% | 0.13% | 0.408 |
| 18 | 595.86× | 0.16% | 0.13% | 0.794 |
| 19 | 1,283.03× | 0.07% | 0.07% | 0.855 |
| 20 | 3,267.64× | 0.03% | 0% | 0 |
| 21 | 10,898.54× | 0.01% | 0% | 0 |
| 22 | 62,162.09× | 0% | 0% | 0 |
| Crossing position | Return multiplier | Modelled chance of reaching here | Share of demos reaching here | Return including the original stake |
|---|---|---|---|---|
| 1 | 1.44× | 66.32% | 67.73% | 0.975 |
| 2 | 2.21× | 43.21% | 43.07% | 0.952 |
| 3 | 3.45× | 27.68% | 28.4% | 0.98 |
| 4 | 5.53× | 17.27% | 18.07% | 0.999 |
| 5 | 9.09× | 10.51% | 10.73% | 0.976 |
| 6 | 15.3× | 6.24% | 6.13% | 0.938 |
| 7 | 26.78× | 3.57% | 3.73% | 1 |
| 8 | 48.7× | 1.96% | 2.27% | 1.104 |
| 9 | 92.54× | 1.03% | 1.13% | 1.049 |
| 10 | 185.08× | 0.52% | 0.6% | 1.11 |
| 11 | 391.25× | 0.24% | 0.33% | 1.304 |
| 12 | 894.28× | 0.11% | 0.13% | 1.192 |
| 13 | 2,235.72× | 0.04% | 0.07% | 1.49 |
| 14 | 6,096.15× | 0.02% | 0% | 0 |
| 15 | 18,960.33× | 0.01% | 0% | 0 |
| 16 | 72,432.75× | 0% | 0% | 0 |
| 17 | 379,632.82× | 0% | 0% | 0 |
| 18 | 3,608,855.25× | 0% | 0% | 0 |
Gross return includes stake. Payout caps apply. No profit forecast.
Limited demo observations. No predictions. Independently unaudited.