Chicken Road
Share reaching each successful step
Easy roadMedium roadHard roadDaredevil road
The games and their workings · Chicken Road vs Chicken Road 2: See Both Games Clearly
This Chicken Road vs Chicken Road 2 comparison puts the money and controls beside each other. Both InOut games ask you to stake, attempt crossings and decide whether to collect after surviving or continue. Their similar appearance can conceal important differences in road length, minimum stake and payout ceiling.

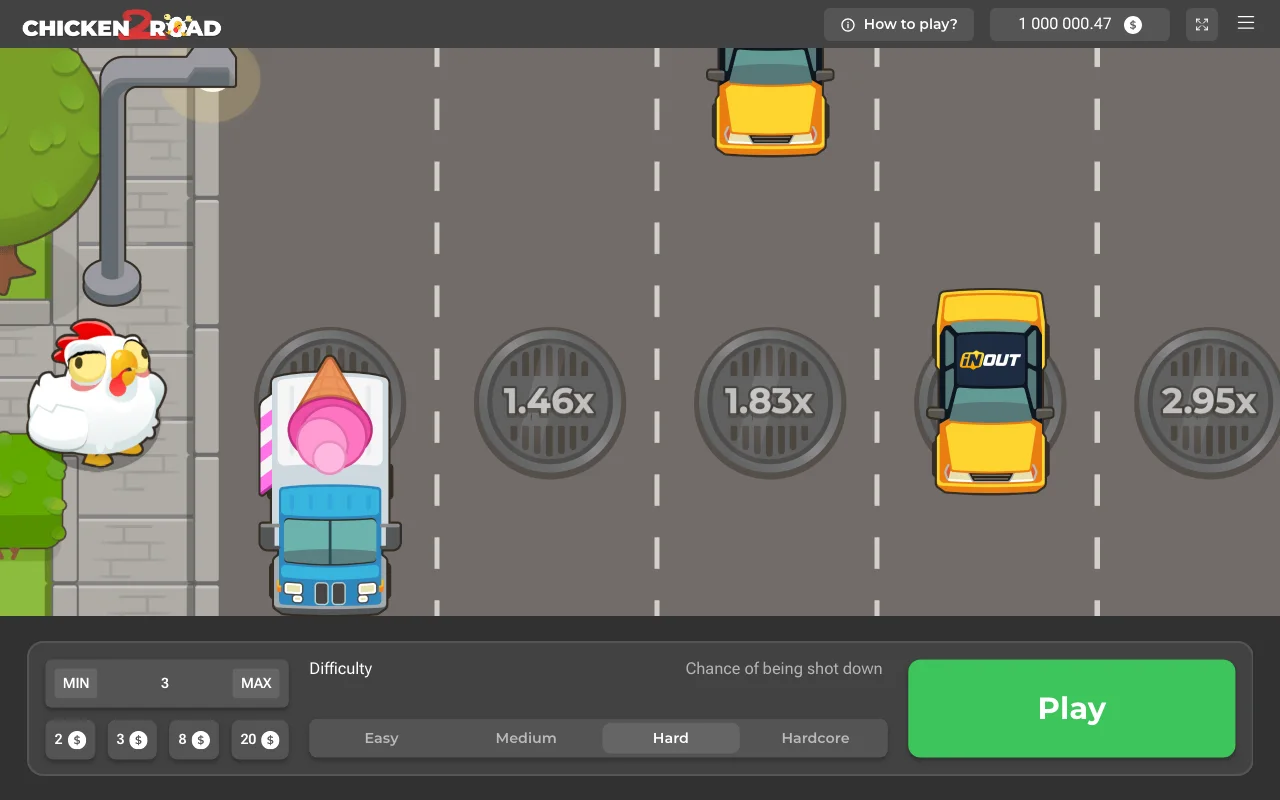
Begin with the first game's controls and limits, then compare the published returns. Road length and payout ceiling do not determine which RTP is higher.
Original Easy begins at ×1.03 and ends at ×19.44; sequel Easy opens at ×1.01 and ends at ×23.24. Original Medium opens at ×1.12, while sequel Medium opens at ×1.08. Those starts help explain why the sequel can feel more gradual in the opening crossings without implying a personal probability of reaching the end.
You can compare the games without committing a stake. Open one free frame, locate its difficulty selector and notice the current collection. Then open the other version and read the mode again. Comparing the same position number alone can hide a different multiplier or distance from the finish. Use the complete ladders when that distinction matters. A longer road offers more listed positions; it does not tell you that a particular attempt will travel farther. After the comparison, you can leave both frames closed and read the linked reviews for the details you still need.
Original Chicken Road accepts USD 0.01–150 stakes. Chicken Road 2 accepts USD 0.12–200. The sequel therefore has a different minimum as well as a higher upper limit. Neither maximum tells you what a sensible amount is for your circumstances, and a larger stake does not buy knowledge of the next outcome.
A casino deposit is another number. For the account you want to use, check the minimum transfer, currency and charges before you put money in. The cashier may require a deposit larger than the original game’s minimum stake. An active bonus can also restrict your stake below the sequel’s upper game limit.
Gross return includes the starting stake. Profit is the amount above it after a winning round. The current collect amount is more useful for the immediate choice than a remote final factor. A later crossing must still survive before its possible amount is available, and the game’s payout ceiling continues to apply.
InOut publishes 98% RTP for original Chicken Road, corresponding to a 2% theoretical house edge. That describes long-run wagering rather than how much of a particular deposit will come back. Re-staking a collected return increases turnover and creates another exposure to loss. The sequel’s long-run house advantage is 4.5%.
Demo credits let you compare the controls without a cash payment. Open original Easy and collect after a surviving step. Then open sequel Easy with a comparable practice approach and notice the different first factor and road length. Only afterwards compare Hard or Daredevil. Changing one thing at a time makes the difference easier to read.
A demo balance has no withdrawal value and a successful practice road cannot predict a later real-money outcome. InOut does not provide a standalone Chicken Road app, so a numbered app icon is insufficient to identify the sequel. Check the title and provider inside the actual browser game, with the controls and balance type visible.
If your aim is understanding, both editions can be compared through their ladders and demo controls. The original has the lower provider minimum; the sequel has longer roads and a higher payout ceiling, with a lower 95.5% RTP. Those are concrete differences rather than a promise that one title will suit every player. With the two-game comparison in mind, read the operator’s licence and whether it accepts players from your country. Then consider whether any gambling spend fits outside your household commitments. A mode or edition should never decide that budget on your behalf, and a bright future multiplier cannot make an uncertain crossing compulsory.
Adults 18+ only. Set time and spending limits while using the two-game comparison; take breaks and never chase losses.
Inside the recorded sample
Fixed starting denominator. Pointwise Wilson intervals. No simultaneous curve coverage.
Demo rounds included: 12,000
Share reaching each successful step
Share reaching each successful step
| Game | Road difficulty chosen | Demo rounds included | Step one survival | Uncertainty around that share | Completed roads | Highest multiplier in these rounds |
|---|---|---|---|---|---|---|
| Chicken Road · Easy road | Easy road | 1,500 | 95.47% | 94.29%–96.41% | 73 | 19.44× |
| Chicken Road · Medium road | Medium road | 1,500 | 87.8% | 86.05%–89.36% | 1 | 1,788.8× |
| Chicken Road · Hard road | Hard road | 1,500 | 81.67% | 79.63%–83.54% | 0 | 2,007.63× |
| Chicken Road · Daredevil road | Daredevil road | 1,500 | 59.4% | 56.89%–61.86% | 0 | 890.19× |
| Chicken Road 2 · Easy road | Easy road | 1,500 | 96.2% | 95.11%–97.06% | 55 | 23.24× |
| Chicken Road 2 · Medium road | Medium road | 1,500 | 89.67% | 88.02%–91.11% | 0 | 638.82× |
| Chicken Road 2 · Hard road | Hard road | 1,500 | 81.67% | 79.63%–83.54% | 0 | 1,283.03× |
| Chicken Road 2 · Daredevil road | Daredevil road | 1,500 | 67.73% | 65.32%–70.05% | 0 | 2,235.72× |
Highest successful step, including later losses. No paid prize.
| Crossing position | Successful rounds | Demo rounds included | Share of demos reaching here | Uncertainty around that share |
|---|---|---|---|---|
| 1 | 1,432 | 1,500 | 95.47% | 94.29%–96.41% |
| 2 | 1,367 | 1,500 | 91.13% | 89.59%–92.47% |
| 3 | 1,316 | 1,500 | 87.73% | 85.98%–89.3% |
| 4 | 1,246 | 1,500 | 83.07% | 81.08%–84.88% |
| 5 | 1,176 | 1,500 | 78.4% | 76.25%–80.41% |
| 6 | 1,112 | 1,500 | 74.13% | 71.86%–76.29% |
| 7 | 1,054 | 1,500 | 70.27% | 67.9%–72.53% |
| 8 | 1,000 | 1,500 | 66.67% | 64.24%–69.01% |
| 9 | 937 | 1,500 | 62.47% | 59.99%–64.88% |
| 10 | 860 | 1,500 | 57.33% | 54.81%–59.81% |
| 11 | 813 | 1,500 | 54.2% | 51.67%–56.71% |
| 12 | 766 | 1,500 | 51.07% | 48.54%–53.59% |
| 13 | 706 | 1,500 | 47.07% | 44.55%–49.6% |
| 14 | 649 | 1,500 | 43.27% | 40.78%–45.79% |
| 15 | 595 | 1,500 | 39.67% | 37.22%–42.17% |
| 16 | 538 | 1,500 | 35.87% | 33.48%–38.33% |
| 17 | 494 | 1,500 | 32.93% | 30.6%–35.35% |
| 18 | 433 | 1,500 | 28.87% | 26.63%–31.21% |
| 19 | 369 | 1,500 | 24.6% | 22.49%–26.84% |
| 20 | 315 | 1,500 | 21% | 19.01%–23.13% |
| 21 | 242 | 1,500 | 16.13% | 14.36%–18.08% |
| 22 | 190 | 1,500 | 12.67% | 11.08%–14.45% |
| 23 | 135 | 1,500 | 9% | 7.65%–10.55% |
| 24 | 73 | 1,500 | 4.87% | 3.89%–6.08% |
| Crossing position | Successful rounds | Demo rounds included | Share of demos reaching here | Uncertainty around that share |
|---|---|---|---|---|
| 1 | 1,317 | 1,500 | 87.8% | 86.05%–89.36% |
| 2 | 1,159 | 1,500 | 77.27% | 75.08%–79.32% |
| 3 | 1,002 | 1,500 | 66.8% | 64.38%–69.14% |
| 4 | 857 | 1,500 | 57.13% | 54.61%–59.62% |
| 5 | 728 | 1,500 | 48.53% | 46.01%–51.06% |
| 6 | 615 | 1,500 | 41% | 38.54%–43.51% |
| 7 | 519 | 1,500 | 34.6% | 32.23%–37.04% |
| 8 | 426 | 1,500 | 28.4% | 26.18%–30.73% |
| 9 | 342 | 1,500 | 22.8% | 20.75%–24.99% |
| 10 | 266 | 1,500 | 17.73% | 15.88%–19.75% |
| 11 | 209 | 1,500 | 13.93% | 12.27%–15.78% |
| 12 | 164 | 1,500 | 10.93% | 9.45%–12.61% |
| 13 | 132 | 1,500 | 8.8% | 7.47%–10.34% |
| 14 | 97 | 1,500 | 6.47% | 5.33%–7.83% |
| 15 | 66 | 1,500 | 4.4% | 3.47%–5.56% |
| 16 | 52 | 1,500 | 3.47% | 2.65%–4.52% |
| 17 | 35 | 1,500 | 2.33% | 1.68%–3.23% |
| 18 | 25 | 1,500 | 1.67% | 1.13%–2.45% |
| 19 | 12 | 1,500 | 0.8% | 0.46%–1.39% |
| 20 | 8 | 1,500 | 0.53% | 0.27%–1.05% |
| 21 | 3 | 1,500 | 0.2% | 0.07%–0.59% |
| 22 | 1 | 1,500 | 0.07% | 0.01%–0.38% |
| Crossing position | Successful rounds | Demo rounds included | Share of demos reaching here | Uncertainty around that share |
|---|---|---|---|---|
| 1 | 1,225 | 1,500 | 81.67% | 79.63%–83.54% |
| 2 | 988 | 1,500 | 65.87% | 63.43%–68.22% |
| 3 | 792 | 1,500 | 52.8% | 50.27%–55.32% |
| 4 | 594 | 1,500 | 39.6% | 37.15%–42.1% |
| 5 | 441 | 1,500 | 29.4% | 27.15%–31.76% |
| 6 | 312 | 1,500 | 20.8% | 18.82%–22.93% |
| 7 | 238 | 1,500 | 15.87% | 14.11%–17.8% |
| 8 | 156 | 1,500 | 10.4% | 8.96%–12.05% |
| 9 | 94 | 1,500 | 6.27% | 5.15%–7.61% |
| 10 | 69 | 1,500 | 4.6% | 3.65%–5.78% |
| 11 | 48 | 1,500 | 3.2% | 2.42%–4.22% |
| 12 | 31 | 1,500 | 2.07% | 1.46%–2.92% |
| 13 | 23 | 1,500 | 1.53% | 1.02%–2.29% |
| 14 | 11 | 1,500 | 0.73% | 0.41%–1.31% |
| 15 | 6 | 1,500 | 0.4% | 0.18%–0.87% |
| 16 | 4 | 1,500 | 0.27% | 0.1%–0.68% |
| 17 | 1 | 1,500 | 0.07% | 0.01%–0.38% |
| 18 | 1 | 1,500 | 0.07% | 0.01%–0.38% |
| 19 | 0 | 1,500 | 0% | 0%–0.26% |
| 20 | 0 | 1,500 | 0% | 0%–0.26% |
| Crossing position | Successful rounds | Demo rounds included | Share of demos reaching here | Uncertainty around that share |
|---|---|---|---|---|
| 1 | 891 | 1,500 | 59.4% | 56.89%–61.86% |
| 2 | 516 | 1,500 | 34.4% | 32.04%–36.84% |
| 3 | 291 | 1,500 | 19.4% | 17.48%–21.48% |
| 4 | 174 | 1,500 | 11.6% | 10.08%–13.32% |
| 5 | 98 | 1,500 | 6.53% | 5.39%–7.9% |
| 6 | 57 | 1,500 | 3.8% | 2.94%–4.89% |
| 7 | 26 | 1,500 | 1.73% | 1.19%–2.53% |
| 8 | 13 | 1,500 | 0.87% | 0.51%–1.48% |
| 9 | 5 | 1,500 | 0.33% | 0.14%–0.78% |
| 10 | 2 | 1,500 | 0.13% | 0.04%–0.48% |
| 11 | 0 | 1,500 | 0% | 0%–0.26% |
| 12 | 0 | 1,500 | 0% | 0%–0.26% |
| 13 | 0 | 1,500 | 0% | 0%–0.26% |
| 14 | 0 | 1,500 | 0% | 0%–0.26% |
| 15 | 0 | 1,500 | 0% | 0%–0.26% |
| Crossing position | Successful rounds | Demo rounds included | Share of demos reaching here | Uncertainty around that share |
|---|---|---|---|---|
| 1 | 1,443 | 1,500 | 96.2% | 95.11%–97.06% |
| 2 | 1,409 | 1,500 | 93.93% | 92.61%–95.03% |
| 3 | 1,358 | 1,500 | 90.53% | 88.95%–91.91% |
| 4 | 1,309 | 1,500 | 87.27% | 85.48%–88.86% |
| 5 | 1,247 | 1,500 | 83.13% | 81.15%–84.94% |
| 6 | 1,202 | 1,500 | 80.13% | 78.04%–82.07% |
| 7 | 1,148 | 1,500 | 76.53% | 74.32%–78.61% |
| 8 | 1,103 | 1,500 | 73.53% | 71.24%–75.7% |
| 9 | 1,059 | 1,500 | 70.6% | 68.24%–72.85% |
| 10 | 1,001 | 1,500 | 66.73% | 64.31%–69.07% |
| 11 | 955 | 1,500 | 63.67% | 61.2%–66.06% |
| 12 | 910 | 1,500 | 60.67% | 58.17%–63.11% |
| 13 | 858 | 1,500 | 57.2% | 54.68%–59.68% |
| 14 | 813 | 1,500 | 54.2% | 51.67%–56.71% |
| 15 | 768 | 1,500 | 51.2% | 48.67%–53.72% |
| 16 | 722 | 1,500 | 48.13% | 45.61%–50.66% |
| 17 | 680 | 1,500 | 45.33% | 42.83%–47.86% |
| 18 | 640 | 1,500 | 42.67% | 40.19%–45.19% |
| 19 | 593 | 1,500 | 39.53% | 37.09%–42.03% |
| 20 | 547 | 1,500 | 36.47% | 34.07%–38.93% |
| 21 | 495 | 1,500 | 33% | 30.67%–35.42% |
| 22 | 452 | 1,500 | 30.13% | 27.86%–32.5% |
| 23 | 395 | 1,500 | 26.33% | 24.17%–28.62% |
| 24 | 347 | 1,500 | 23.13% | 21.07%–25.33% |
| 25 | 300 | 1,500 | 20% | 18.05%–22.1% |
| 26 | 245 | 1,500 | 16.33% | 14.55%–18.29% |
| 27 | 196 | 1,500 | 13.07% | 11.45%–14.87% |
| 28 | 152 | 1,500 | 10.13% | 8.71%–11.76% |
| 29 | 107 | 1,500 | 7.13% | 5.94%–8.55% |
| 30 | 55 | 1,500 | 3.67% | 2.83%–4.74% |
| Crossing position | Successful rounds | Demo rounds included | Share of demos reaching here | Uncertainty around that share |
|---|---|---|---|---|
| 1 | 1,345 | 1,500 | 89.67% | 88.02%–91.11% |
| 2 | 1,179 | 1,500 | 78.6% | 76.45%–80.6% |
| 3 | 1,053 | 1,500 | 70.2% | 67.84%–72.46% |
| 4 | 926 | 1,500 | 61.73% | 59.25%–64.16% |
| 5 | 807 | 1,500 | 53.8% | 51.27%–56.31% |
| 6 | 705 | 1,500 | 47% | 44.49%–49.53% |
| 7 | 621 | 1,500 | 41.4% | 38.93%–43.91% |
| 8 | 543 | 1,500 | 36.2% | 33.81%–38.66% |
| 9 | 461 | 1,500 | 30.73% | 28.45%–33.11% |
| 10 | 380 | 1,500 | 25.33% | 23.2%–27.6% |
| 11 | 321 | 1,500 | 21.4% | 19.4%–23.55% |
| 12 | 264 | 1,500 | 17.6% | 15.76%–19.61% |
| 13 | 210 | 1,500 | 14% | 12.34%–15.85% |
| 14 | 172 | 1,500 | 11.47% | 9.95%–13.18% |
| 15 | 134 | 1,500 | 8.93% | 7.59%–10.48% |
| 16 | 94 | 1,500 | 6.27% | 5.15%–7.61% |
| 17 | 76 | 1,500 | 5.07% | 4.07%–6.3% |
| 18 | 54 | 1,500 | 3.6% | 2.77%–4.67% |
| 19 | 42 | 1,500 | 2.8% | 2.08%–3.76% |
| 20 | 31 | 1,500 | 2.07% | 1.46%–2.92% |
| 21 | 18 | 1,500 | 1.2% | 0.76%–1.89% |
| 22 | 7 | 1,500 | 0.47% | 0.23%–0.96% |
| 23 | 4 | 1,500 | 0.27% | 0.1%–0.68% |
| 24 | 1 | 1,500 | 0.07% | 0.01%–0.38% |
| 25 | 0 | 1,500 | 0% | 0%–0.26% |
| Crossing position | Successful rounds | Demo rounds included | Share of demos reaching here | Uncertainty around that share |
|---|---|---|---|---|
| 1 | 1,225 | 1,500 | 81.67% | 79.63%–83.54% |
| 2 | 970 | 1,500 | 64.67% | 62.21%–67.05% |
| 3 | 780 | 1,500 | 52% | 49.47%–54.52% |
| 4 | 616 | 1,500 | 41.07% | 38.6%–43.58% |
| 5 | 468 | 1,500 | 31.2% | 28.91%–33.59% |
| 6 | 355 | 1,500 | 23.67% | 21.58%–25.88% |
| 7 | 258 | 1,500 | 17.2% | 15.37%–19.19% |
| 8 | 196 | 1,500 | 13.07% | 11.45%–14.87% |
| 9 | 142 | 1,500 | 9.47% | 8.09%–11.05% |
| 10 | 96 | 1,500 | 6.4% | 5.27%–7.75% |
| 11 | 70 | 1,500 | 4.67% | 3.71%–5.85% |
| 12 | 51 | 1,500 | 3.4% | 2.6%–4.44% |
| 13 | 29 | 1,500 | 1.93% | 1.35%–2.76% |
| 14 | 17 | 1,500 | 1.13% | 0.71%–1.81% |
| 15 | 8 | 1,500 | 0.53% | 0.27%–1.05% |
| 16 | 5 | 1,500 | 0.33% | 0.14%–0.78% |
| 17 | 2 | 1,500 | 0.13% | 0.04%–0.48% |
| 18 | 2 | 1,500 | 0.13% | 0.04%–0.48% |
| 19 | 1 | 1,500 | 0.07% | 0.01%–0.38% |
| 20 | 0 | 1,500 | 0% | 0%–0.26% |
| 21 | 0 | 1,500 | 0% | 0%–0.26% |
| 22 | 0 | 1,500 | 0% | 0%–0.26% |
| Crossing position | Successful rounds | Demo rounds included | Share of demos reaching here | Uncertainty around that share |
|---|---|---|---|---|
| 1 | 1,016 | 1,500 | 67.73% | 65.32%–70.05% |
| 2 | 646 | 1,500 | 43.07% | 40.58%–45.59% |
| 3 | 426 | 1,500 | 28.4% | 26.18%–30.73% |
| 4 | 271 | 1,500 | 18.07% | 16.2%–20.09% |
| 5 | 161 | 1,500 | 10.73% | 9.27%–12.4% |
| 6 | 92 | 1,500 | 6.13% | 5.03%–7.46% |
| 7 | 56 | 1,500 | 3.73% | 2.89%–4.82% |
| 8 | 34 | 1,500 | 2.27% | 1.63%–3.15% |
| 9 | 17 | 1,500 | 1.13% | 0.71%–1.81% |
| 10 | 9 | 1,500 | 0.6% | 0.32%–1.14% |
| 11 | 5 | 1,500 | 0.33% | 0.14%–0.78% |
| 12 | 2 | 1,500 | 0.13% | 0.04%–0.48% |
| 13 | 1 | 1,500 | 0.07% | 0.01%–0.38% |
| 14 | 0 | 1,500 | 0% | 0%–0.26% |
| 15 | 0 | 1,500 | 0% | 0%–0.26% |
| 16 | 0 | 1,500 | 0% | 0%–0.26% |
| 17 | 0 | 1,500 | 0% | 0%–0.26% |
| 18 | 0 | 1,500 | 0% | 0%–0.26% |
Demo observations. No forecasts. No independent RTP audit.
Model: RTP ÷ multiplier. Independently unverified.
| Crossing position | Share of demos reaching here | Uncertainty around that share | Modelled chance of reaching here |
|---|---|---|---|
| 1 | 95.47% | 94.29% – 96.41% | 95.15% |
| 2 | 91.13% | 89.59% – 92.47% | 91.59% |
| 3 | 87.73% | 85.98% – 89.3% | 87.5% |
| 4 | 83.07% | 81.08% – 84.88% | 83.76% |
| 5 | 78.4% | 76.25% – 80.41% | 79.67% |
| 6 | 74.13% | 71.86% – 76.29% | 75.97% |
| 7 | 70.27% | 67.9% – 72.53% | 72.06% |
| 8 | 66.67% | 64.24% – 69.01% | 68.06% |
| 9 | 62.47% | 59.99% – 64.88% | 64.05% |
| 10 | 57.33% | 54.81% – 59.81% | 60.12% |
| 11 | 54.2% | 51.67% – 56.71% | 56% |
| 12 | 51.07% | 48.54% – 53.59% | 52.13% |
| 13 | 47.07% | 44.55% – 49.6% | 48.04% |
| 14 | 43.27% | 40.78% – 45.79% | 44.14% |
| 15 | 39.67% | 37.22% – 42.17% | 40% |
| 16 | 35.87% | 33.48% – 38.33% | 36.03% |
| 17 | 32.93% | 30.6% – 35.35% | 32.03% |
| 18 | 28.87% | 26.63% – 31.21% | 28% |
| 19 | 24.6% | 22.49% – 26.84% | 24.02% |
| 20 | 21% | 19.01% – 23.13% | 20% |
| 21 | 16.13% | 14.36% – 18.08% | 15.99% |
| 22 | 12.67% | 11.08% – 14.45% | 14.83% |
| 23 | 9% | 7.65% – 10.55% | 9.99% |
| 24 | 4.87% | 3.89% – 6.08% | 5.04% |
| Crossing position | Share of demos reaching here | Uncertainty around that share | Modelled chance of reaching here |
|---|---|---|---|
| 1 | 87.8% | 86.05% – 89.36% | 87.5% |
| 2 | 77.27% | 75.08% – 79.32% | 76.56% |
| 3 | 66.8% | 64.38% – 69.14% | 66.67% |
| 4 | 57.13% | 54.61% – 59.62% | 57.65% |
| 5 | 48.53% | 46.01% – 51.06% | 49.49% |
| 6 | 41% | 38.54% – 43.51% | 42.06% |
| 7 | 34.6% | 32.23% – 37.04% | 35.51% |
| 8 | 28.4% | 26.18% – 30.73% | 29.52% |
| 9 | 22.8% | 20.75% – 24.99% | 24.32% |
| 10 | 17.73% | 15.88% – 19.75% | 19.76% |
| 11 | 13.93% | 12.27% – 15.78% | 15.81% |
| 12 | 10.93% | 9.45% – 12.61% | 14.18% |
| 13 | 8.8% | 7.47% – 10.34% | 11.01% |
| 14 | 6.47% | 5.33% – 7.83% | 8.35% |
| 15 | 4.4% | 3.47% – 5.56% | 6.13% |
| 16 | 3.47% | 2.65% – 4.52% | 4.33% |
| 17 | 2.33% | 1.68% – 3.23% | 2.92% |
| 18 | 1.67% | 1.13% – 2.45% | 1.84% |
| 19 | 0.8% | 0.46% – 1.39% | 1.06% |
| 20 | 0.53% | 0.27% – 1.05% | 0.54% |
| 21 | 0.2% | 0.07% – 0.59% | 0.22% |
| 22 | 0.07% | 0.01% – 0.38% | 0.05% |
| Crossing position | Share of demos reaching here | Uncertainty around that share | Modelled chance of reaching here |
|---|---|---|---|
| 1 | 81.67% | 79.63% – 83.54% | 79.67% |
| 2 | 65.87% | 63.43% – 68.22% | 63.23% |
| 3 | 52.8% | 50.27% – 55.32% | 49.49% |
| 4 | 39.6% | 37.15% – 42.1% | 38.28% |
| 5 | 29.4% | 27.15% – 31.76% | 29.17% |
| 6 | 20.8% | 18.82% – 22.93% | 21.83% |
| 7 | 15.87% | 14.11% – 17.8% | 17.85% |
| 8 | 10.4% | 8.96% – 12.05% | 13.01% |
| 9 | 6.27% | 5.15% – 7.61% | 9.28% |
| 10 | 4.6% | 3.65% – 5.78% | 6.44% |
| 11 | 3.2% | 2.42% – 4.22% | 4.34% |
| 12 | 2.07% | 1.46% – 2.92% | 2.82% |
| 13 | 1.53% | 1.02% – 2.29% | 1.75% |
| 14 | 0.73% | 0.41% – 1.31% | 1.03% |
| 15 | 0.4% | 0.18% – 0.87% | 0.57% |
| 16 | 0.27% | 0.1% – 0.68% | 0.29% |
| 17 | 0.07% | 0.01% – 0.38% | 0.13% |
| 18 | 0.07% | 0.01% – 0.38% | 0.05% |
| 19 | 0% | 0% – 0.26% | 0.01% |
| 20 | 0% | 0% – 0.26% | 0% |
| Crossing position | Share of demos reaching here | Uncertainty around that share | Modelled chance of reaching here |
|---|---|---|---|
| 1 | 59.4% | 56.89% – 61.86% | 60.12% |
| 2 | 34.4% | 32.04% – 36.84% | 35% |
| 3 | 19.4% | 17.48% – 21.48% | 19.8% |
| 4 | 11.6% | 10.08% – 13.32% | 10.79% |
| 5 | 6.53% | 5.39% – 7.9% | 6.44% |
| 6 | 3.8% | 2.94% – 4.89% | 3.25% |
| 7 | 1.73% | 1.19% – 2.53% | 1.56% |
| 8 | 0.87% | 0.51% – 1.48% | 0.7% |
| 9 | 0.33% | 0.14% – 0.78% | 0.29% |
| 10 | 0.13% | 0.04% – 0.48% | 0.11% |
| 11 | 0% | 0% – 0.26% | 0.04% |
| 12 | 0% | 0% – 0.26% | 0.01% |
| 13 | 0% | 0% – 0.26% | 0% |
| 14 | 0% | 0% – 0.26% | 0% |
| 15 | 0% | 0% – 0.26% | 0% |
| Crossing position | Share of demos reaching here | Uncertainty around that share | Modelled chance of reaching here |
|---|---|---|---|
| 1 | 96.2% | 95.11% – 97.06% | 94.55% |
| 2 | 93.93% | 92.61% – 95.03% | 92.72% |
| 3 | 90.53% | 88.95% – 91.91% | 90.09% |
| 4 | 87.27% | 85.48% – 88.86% | 86.82% |
| 5 | 83.13% | 81.15% – 84.94% | 83.04% |
| 6 | 80.13% | 78.04% – 82.07% | 80.25% |
| 7 | 76.53% | 74.32% – 78.61% | 77.02% |
| 8 | 73.53% | 71.24% – 75.7% | 73.46% |
| 9 | 70.6% | 68.24% – 72.85% | 70.74% |
| 10 | 66.73% | 64.31% – 69.07% | 67.25% |
| 11 | 63.67% | 61.2% – 66.06% | 64.53% |
| 12 | 60.67% | 58.17% – 63.11% | 61.22% |
| 13 | 57.2% | 54.68% – 59.68% | 57.88% |
| 14 | 54.2% | 51.67% – 56.71% | 54.57% |
| 15 | 51.2% | 48.67% – 53.72% | 51.62% |
| 16 | 48.13% | 45.61% – 50.66% | 48.23% |
| 17 | 45.33% | 42.83% – 47.86% | 45.05% |
| 18 | 42.67% | 40.19% – 45.19% | 41.89% |
| 19 | 39.53% | 37.09% – 42.03% | 38.66% |
| 20 | 36.47% | 34.07% – 38.93% | 35.37% |
| 21 | 33% | 30.67% – 35.42% | 32.26% |
| 22 | 30.13% | 27.86% – 32.5% | 29.12% |
| 23 | 26.33% | 24.17% – 28.62% | 25.81% |
| 24 | 23.13% | 21.07% – 25.33% | 23.24% |
| 25 | 20% | 18.05% – 22.1% | 20.58% |
| 26 | 16.33% | 14.55% – 18.29% | 17.72% |
| 27 | 13.07% | 11.45% – 14.87% | 14.69% |
| 28 | 10.13% | 8.71% – 11.76% | 11.42% |
| 29 | 7.13% | 5.94% – 8.55% | 7.91% |
| 30 | 3.67% | 2.83% – 4.74% | 4.11% |
| Crossing position | Share of demos reaching here | Uncertainty around that share | Modelled chance of reaching here |
|---|---|---|---|
| 1 | 89.67% | 88.02% – 91.11% | 88.43% |
| 2 | 78.6% | 76.45% – 80.6% | 78.93% |
| 3 | 70.2% | 67.84% – 72.46% | 69.71% |
| 4 | 61.73% | 59.25% – 64.16% | 61.22% |
| 5 | 53.8% | 51.27% – 56.31% | 53.65% |
| 6 | 47% | 44.49% – 49.53% | 46.59% |
| 7 | 41.4% | 38.93% – 43.91% | 40.3% |
| 8 | 36.2% | 33.81% – 38.66% | 34.48% |
| 9 | 30.73% | 28.45% – 33.11% | 29.48% |
| 10 | 25.33% | 23.2% – 27.6% | 24.81% |
| 11 | 21.4% | 19.4% – 23.55% | 20.67% |
| 12 | 17.6% | 15.76% – 19.61% | 17.02% |
| 13 | 14% | 12.34% – 15.85% | 13.82% |
| 14 | 11.47% | 9.95% – 13.18% | 11.05% |
| 15 | 8.93% | 7.59% – 10.48% | 8.69% |
| 16 | 6.27% | 5.15% – 7.61% | 6.68% |
| 17 | 5.07% | 4.07% – 6.3% | 5.04% |
| 18 | 3.6% | 2.77% – 4.67% | 3.66% |
| 19 | 2.8% | 2.08% – 3.76% | 2.56% |
| 20 | 2.07% | 1.46% – 2.92% | 1.77% |
| 21 | 1.2% | 0.76% – 1.89% | 1.16% |
| 22 | 0.47% | 0.23% – 0.96% | 0.69% |
| 23 | 0.27% | 0.1% – 0.68% | 0.36% |
| 24 | 0.07% | 0.01% – 0.38% | 0.15% |
| 25 | 0% | 0% – 0.26% | 0.04% |
| Crossing position | Share of demos reaching here | Uncertainty around that share | Modelled chance of reaching here |
|---|---|---|---|
| 1 | 81.67% | 79.63% – 83.54% | 80.93% |
| 2 | 64.67% | 62.21% – 67.05% | 65.41% |
| 3 | 52% | 49.47% – 54.52% | 52.19% |
| 4 | 41.07% | 38.6% – 43.58% | 41.34% |
| 5 | 31.2% | 28.91% – 33.59% | 32.37% |
| 6 | 23.67% | 21.58% – 25.88% | 25% |
| 7 | 17.2% | 15.37% – 19.19% | 19.02% |
| 8 | 13.07% | 11.45% – 14.87% | 14.34% |
| 9 | 9.47% | 8.09% – 11.05% | 10.56% |
| 10 | 6.4% | 5.27% – 7.75% | 7.63% |
| 11 | 4.67% | 3.71% – 5.85% | 5.38% |
| 12 | 3.4% | 2.6% – 4.44% | 3.7% |
| 13 | 1.93% | 1.35% – 2.76% | 2.47% |
| 14 | 1.13% | 0.71% – 1.81% | 1.59% |
| 15 | 0.53% | 0.27% – 1.05% | 0.98% |
| 16 | 0.33% | 0.14% – 0.78% | 0.57% |
| 17 | 0.13% | 0.04% – 0.48% | 0.31% |
| 18 | 0.13% | 0.04% – 0.48% | 0.16% |
| 19 | 0.07% | 0.01% – 0.38% | 0.07% |
| 20 | 0% | 0% – 0.26% | 0.03% |
| 21 | 0% | 0% – 0.26% | 0.01% |
| 22 | 0% | 0% – 0.26% | 0% |
| Crossing position | Share of demos reaching here | Uncertainty around that share | Modelled chance of reaching here |
|---|---|---|---|
| 1 | 67.73% | 65.32% – 70.05% | 66.32% |
| 2 | 43.07% | 40.58% – 45.59% | 43.21% |
| 3 | 28.4% | 26.18% – 30.73% | 27.68% |
| 4 | 18.07% | 16.2% – 20.09% | 17.27% |
| 5 | 10.73% | 9.27% – 12.4% | 10.51% |
| 6 | 6.13% | 5.03% – 7.46% | 6.24% |
| 7 | 3.73% | 2.89% – 4.82% | 3.57% |
| 8 | 2.27% | 1.63% – 3.15% | 1.96% |
| 9 | 1.13% | 0.71% – 1.81% | 1.03% |
| 10 | 0.6% | 0.32% – 1.14% | 0.52% |
| 11 | 0.33% | 0.14% – 0.78% | 0.24% |
| 12 | 0.13% | 0.04% – 0.48% | 0.11% |
| 13 | 0.07% | 0.01% – 0.38% | 0.04% |
| 14 | 0% | 0% – 0.26% | 0.02% |
| 15 | 0% | 0% – 0.26% | 0.01% |
| 16 | 0% | 0% – 0.26% | 0% |
| 17 | 0% | 0% – 0.26% | 0% |
| 18 | 0% | 0% – 0.26% | 0% |