Chicken Road
Share reaching each successful step
Easy settingMedium settingHard settingDaredevil setting
Get to know the crossing game · Chicken Road vs Chicken Road 2: Compare the Rules
This Chicken Road vs Chicken Road 2 comparison puts the shared crossing choice beside the differences in steps, stakes and payout ceilings.

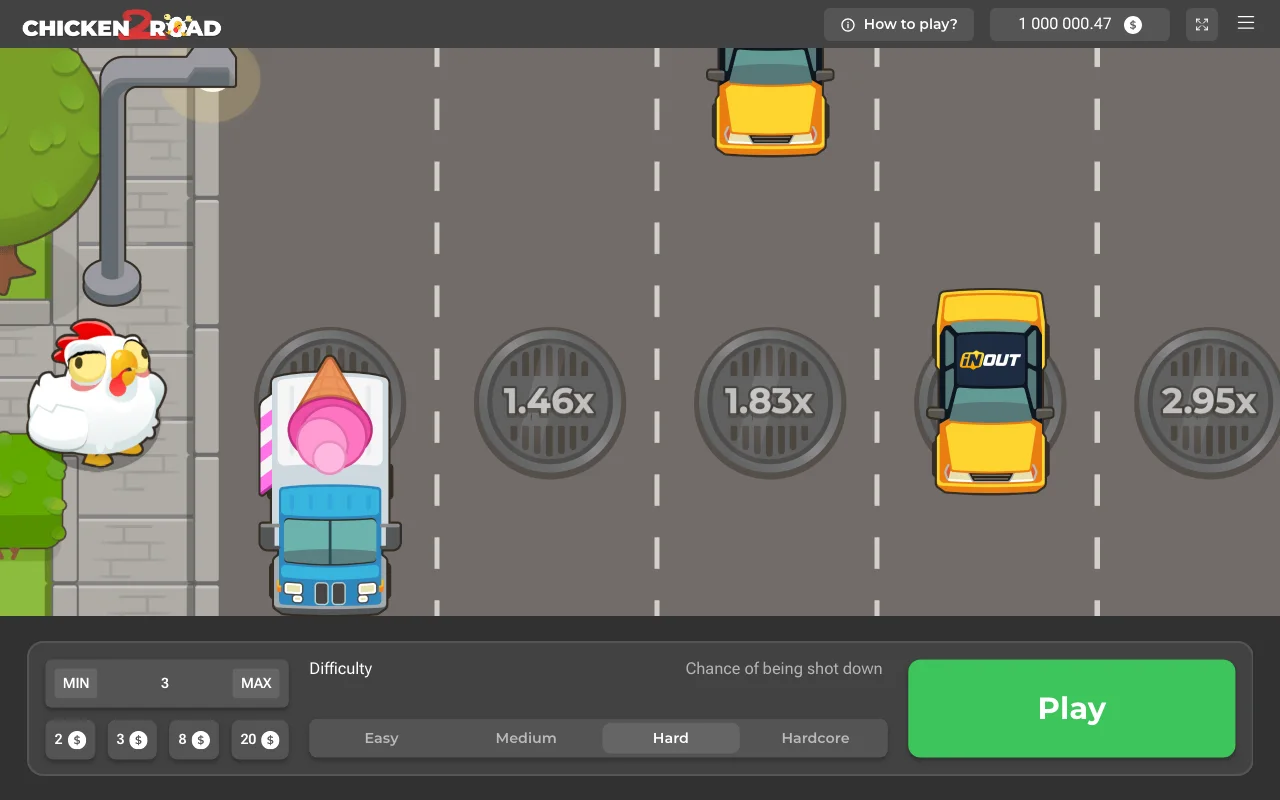
Compare what each edition discloses without assuming that the newer game promises a better personal outcome.
Start the Chicken Road comparison with the gentlest-labelled roads. Original Easy has 24 positions, from ×1.03 at the opening step to ×19.44 at the end. Sequel Easy has 30 positions, beginning at ×1.01 and ending at ×23.24. The sequel therefore changes both the first increase and the number of listed choices.
A longer road does not mean your round will last longer or reach its final tile. Compare the current collect amount at the same practice stake, while keeping the edition label visible. The word Easy remains a mode name rather than protection for the stake. This side-by-side view explains the pace of each ladder without presenting either as a certain route to a payout.
Chicken Road 2 retains the collect-or-continue choice but adds positions to every difficulty. The sequel’s Easy, Medium, Hard and Daredevil roads contain 30, 25, 22 and 18 steps; the original has 24, 22, 20 and 15. Read the title and mode together when comparing a shared position number. The corresponding long-run house edge is 4.5%.
The sequel also has a different stake range and ceiling: USD 0.12–200 per round and a USD 20,000 maximum win. Its RTP is 95.5% per InOut. A newer title and a larger possible payment are concrete differences, not reasons to assume a more favourable personal result. Leave the original’s 98% RTP attached to the original when comparing what each edition actually discloses.
The sequel Medium ladder runs across 25 positions from ×1.08 to ×2,457. Its Hard road has 22, from ×1.18 to ×62,162.09. Daredevil has 18, opening at ×1.44 and ending at ×3,608,855.25. These figures should stay beside their mode labels rather than being combined into one “maximum multiplier” headline.
For a useful mode comparison, look at the opening factors and road lengths before the final values. They show how the possible return begins to develop. Keep the sequel’s USD 20,000 cap visible when looking at the steepest endpoint. Neither opening nor final factor predicts a new round. The larger ceiling does not raise the sequel’s lower 95.5% theoretical return.
The original’s smallest provider stake is USD 0.01 and its upper game stake is USD 150. The sequel starts at USD 0.12 and extends to USD 200. That difference changes the smallest commitment available within the game; it does not identify a suitable amount for every reader.
A casino can use a different account currency and its own cashier minimums. Read the conversion and charges rather than treating a USD game limit as a local deposit amount. Gross return includes the stake when multiplied by a factor, subject to the applicable cap. A higher permitted stake increases the money at risk and cannot buy advance knowledge of whether the next crossing will survive.
Original Chicken Road has a USD 10,000 maximum win; Chicken Road 2 has USD 20,000. Put those ceilings next to the final factors when deciding what the largest numbers mean. A multiplication that exceeds the ceiling cannot be read as an uncapped payable amount.
Keep the account questions alongside, but separate from, the game calculation. Withdrawal conditions, identity checks and active bonus restrictions belong to the operator. A higher game maximum cannot promise a faster transfer or remove an account requirement. The useful comparison lists the stake, reached factor and cap for each edition without turning either ceiling into a target that repeated play is supposed to reach.
Keep each published return percentage beside its own game. The first game's review provides the original limits for this comparison.
Keep the lower return explicit beside the sequel’s higher limits. A limited demo history cannot verify theoretical return. The original’s 98% exceeds the sequel’s 95.5% over the long run. This does not prevent comparison of the controls, minimum stakes or road lengths. It does limit any claim that one edition is mathematically better based on its larger last multiplier alone.
Adults 18+ only. While exploring the two-game comparison, set time and spending limits, take breaks and never chase losses.
Inside the recorded sample
Fixed starting denominator. Pointwise Wilson intervals. No simultaneous curve coverage.
Rounds in this demo run: 12,000
Share reaching each successful step
Share reaching each successful step
| Game | Selected road | Rounds in this demo run | Step one survival | Range around this proportion | Completed roads | Largest reached coefficient |
|---|---|---|---|---|---|---|
| Chicken Road · Easy setting | Easy setting | 1,500 | 95.47% | 94.29%–96.41% | 73 | 19.44× |
| Chicken Road · Medium setting | Medium setting | 1,500 | 87.8% | 86.05%–89.36% | 1 | 1,788.8× |
| Chicken Road · Hard setting | Hard setting | 1,500 | 81.67% | 79.63%–83.54% | 0 | 2,007.63× |
| Chicken Road · Daredevil setting | Daredevil setting | 1,500 | 59.4% | 56.89%–61.86% | 0 | 890.19× |
| Chicken Road 2 · Easy setting | Easy setting | 1,500 | 96.2% | 95.11%–97.06% | 55 | 23.24× |
| Chicken Road 2 · Medium setting | Medium setting | 1,500 | 89.67% | 88.02%–91.11% | 0 | 638.82× |
| Chicken Road 2 · Hard setting | Hard setting | 1,500 | 81.67% | 79.63%–83.54% | 0 | 1,283.03× |
| Chicken Road 2 · Daredevil setting | Daredevil setting | 1,500 | 67.73% | 65.32%–70.05% | 0 | 2,235.72× |
Highest successful step, including later losses. No paid prize.
| Position on the road | Successful rounds | Rounds in this demo run | Share of these rounds reaching the position | Range around this proportion |
|---|---|---|---|---|
| 1 | 1,432 | 1,500 | 95.47% | 94.29%–96.41% |
| 2 | 1,367 | 1,500 | 91.13% | 89.59%–92.47% |
| 3 | 1,316 | 1,500 | 87.73% | 85.98%–89.3% |
| 4 | 1,246 | 1,500 | 83.07% | 81.08%–84.88% |
| 5 | 1,176 | 1,500 | 78.4% | 76.25%–80.41% |
| 6 | 1,112 | 1,500 | 74.13% | 71.86%–76.29% |
| 7 | 1,054 | 1,500 | 70.27% | 67.9%–72.53% |
| 8 | 1,000 | 1,500 | 66.67% | 64.24%–69.01% |
| 9 | 937 | 1,500 | 62.47% | 59.99%–64.88% |
| 10 | 860 | 1,500 | 57.33% | 54.81%–59.81% |
| 11 | 813 | 1,500 | 54.2% | 51.67%–56.71% |
| 12 | 766 | 1,500 | 51.07% | 48.54%–53.59% |
| 13 | 706 | 1,500 | 47.07% | 44.55%–49.6% |
| 14 | 649 | 1,500 | 43.27% | 40.78%–45.79% |
| 15 | 595 | 1,500 | 39.67% | 37.22%–42.17% |
| 16 | 538 | 1,500 | 35.87% | 33.48%–38.33% |
| 17 | 494 | 1,500 | 32.93% | 30.6%–35.35% |
| 18 | 433 | 1,500 | 28.87% | 26.63%–31.21% |
| 19 | 369 | 1,500 | 24.6% | 22.49%–26.84% |
| 20 | 315 | 1,500 | 21% | 19.01%–23.13% |
| 21 | 242 | 1,500 | 16.13% | 14.36%–18.08% |
| 22 | 190 | 1,500 | 12.67% | 11.08%–14.45% |
| 23 | 135 | 1,500 | 9% | 7.65%–10.55% |
| 24 | 73 | 1,500 | 4.87% | 3.89%–6.08% |
| Position on the road | Successful rounds | Rounds in this demo run | Share of these rounds reaching the position | Range around this proportion |
|---|---|---|---|---|
| 1 | 1,317 | 1,500 | 87.8% | 86.05%–89.36% |
| 2 | 1,159 | 1,500 | 77.27% | 75.08%–79.32% |
| 3 | 1,002 | 1,500 | 66.8% | 64.38%–69.14% |
| 4 | 857 | 1,500 | 57.13% | 54.61%–59.62% |
| 5 | 728 | 1,500 | 48.53% | 46.01%–51.06% |
| 6 | 615 | 1,500 | 41% | 38.54%–43.51% |
| 7 | 519 | 1,500 | 34.6% | 32.23%–37.04% |
| 8 | 426 | 1,500 | 28.4% | 26.18%–30.73% |
| 9 | 342 | 1,500 | 22.8% | 20.75%–24.99% |
| 10 | 266 | 1,500 | 17.73% | 15.88%–19.75% |
| 11 | 209 | 1,500 | 13.93% | 12.27%–15.78% |
| 12 | 164 | 1,500 | 10.93% | 9.45%–12.61% |
| 13 | 132 | 1,500 | 8.8% | 7.47%–10.34% |
| 14 | 97 | 1,500 | 6.47% | 5.33%–7.83% |
| 15 | 66 | 1,500 | 4.4% | 3.47%–5.56% |
| 16 | 52 | 1,500 | 3.47% | 2.65%–4.52% |
| 17 | 35 | 1,500 | 2.33% | 1.68%–3.23% |
| 18 | 25 | 1,500 | 1.67% | 1.13%–2.45% |
| 19 | 12 | 1,500 | 0.8% | 0.46%–1.39% |
| 20 | 8 | 1,500 | 0.53% | 0.27%–1.05% |
| 21 | 3 | 1,500 | 0.2% | 0.07%–0.59% |
| 22 | 1 | 1,500 | 0.07% | 0.01%–0.38% |
| Position on the road | Successful rounds | Rounds in this demo run | Share of these rounds reaching the position | Range around this proportion |
|---|---|---|---|---|
| 1 | 1,225 | 1,500 | 81.67% | 79.63%–83.54% |
| 2 | 988 | 1,500 | 65.87% | 63.43%–68.22% |
| 3 | 792 | 1,500 | 52.8% | 50.27%–55.32% |
| 4 | 594 | 1,500 | 39.6% | 37.15%–42.1% |
| 5 | 441 | 1,500 | 29.4% | 27.15%–31.76% |
| 6 | 312 | 1,500 | 20.8% | 18.82%–22.93% |
| 7 | 238 | 1,500 | 15.87% | 14.11%–17.8% |
| 8 | 156 | 1,500 | 10.4% | 8.96%–12.05% |
| 9 | 94 | 1,500 | 6.27% | 5.15%–7.61% |
| 10 | 69 | 1,500 | 4.6% | 3.65%–5.78% |
| 11 | 48 | 1,500 | 3.2% | 2.42%–4.22% |
| 12 | 31 | 1,500 | 2.07% | 1.46%–2.92% |
| 13 | 23 | 1,500 | 1.53% | 1.02%–2.29% |
| 14 | 11 | 1,500 | 0.73% | 0.41%–1.31% |
| 15 | 6 | 1,500 | 0.4% | 0.18%–0.87% |
| 16 | 4 | 1,500 | 0.27% | 0.1%–0.68% |
| 17 | 1 | 1,500 | 0.07% | 0.01%–0.38% |
| 18 | 1 | 1,500 | 0.07% | 0.01%–0.38% |
| 19 | 0 | 1,500 | 0% | 0%–0.26% |
| 20 | 0 | 1,500 | 0% | 0%–0.26% |
| Position on the road | Successful rounds | Rounds in this demo run | Share of these rounds reaching the position | Range around this proportion |
|---|---|---|---|---|
| 1 | 891 | 1,500 | 59.4% | 56.89%–61.86% |
| 2 | 516 | 1,500 | 34.4% | 32.04%–36.84% |
| 3 | 291 | 1,500 | 19.4% | 17.48%–21.48% |
| 4 | 174 | 1,500 | 11.6% | 10.08%–13.32% |
| 5 | 98 | 1,500 | 6.53% | 5.39%–7.9% |
| 6 | 57 | 1,500 | 3.8% | 2.94%–4.89% |
| 7 | 26 | 1,500 | 1.73% | 1.19%–2.53% |
| 8 | 13 | 1,500 | 0.87% | 0.51%–1.48% |
| 9 | 5 | 1,500 | 0.33% | 0.14%–0.78% |
| 10 | 2 | 1,500 | 0.13% | 0.04%–0.48% |
| 11 | 0 | 1,500 | 0% | 0%–0.26% |
| 12 | 0 | 1,500 | 0% | 0%–0.26% |
| 13 | 0 | 1,500 | 0% | 0%–0.26% |
| 14 | 0 | 1,500 | 0% | 0%–0.26% |
| 15 | 0 | 1,500 | 0% | 0%–0.26% |
| Position on the road | Successful rounds | Rounds in this demo run | Share of these rounds reaching the position | Range around this proportion |
|---|---|---|---|---|
| 1 | 1,443 | 1,500 | 96.2% | 95.11%–97.06% |
| 2 | 1,409 | 1,500 | 93.93% | 92.61%–95.03% |
| 3 | 1,358 | 1,500 | 90.53% | 88.95%–91.91% |
| 4 | 1,309 | 1,500 | 87.27% | 85.48%–88.86% |
| 5 | 1,247 | 1,500 | 83.13% | 81.15%–84.94% |
| 6 | 1,202 | 1,500 | 80.13% | 78.04%–82.07% |
| 7 | 1,148 | 1,500 | 76.53% | 74.32%–78.61% |
| 8 | 1,103 | 1,500 | 73.53% | 71.24%–75.7% |
| 9 | 1,059 | 1,500 | 70.6% | 68.24%–72.85% |
| 10 | 1,001 | 1,500 | 66.73% | 64.31%–69.07% |
| 11 | 955 | 1,500 | 63.67% | 61.2%–66.06% |
| 12 | 910 | 1,500 | 60.67% | 58.17%–63.11% |
| 13 | 858 | 1,500 | 57.2% | 54.68%–59.68% |
| 14 | 813 | 1,500 | 54.2% | 51.67%–56.71% |
| 15 | 768 | 1,500 | 51.2% | 48.67%–53.72% |
| 16 | 722 | 1,500 | 48.13% | 45.61%–50.66% |
| 17 | 680 | 1,500 | 45.33% | 42.83%–47.86% |
| 18 | 640 | 1,500 | 42.67% | 40.19%–45.19% |
| 19 | 593 | 1,500 | 39.53% | 37.09%–42.03% |
| 20 | 547 | 1,500 | 36.47% | 34.07%–38.93% |
| 21 | 495 | 1,500 | 33% | 30.67%–35.42% |
| 22 | 452 | 1,500 | 30.13% | 27.86%–32.5% |
| 23 | 395 | 1,500 | 26.33% | 24.17%–28.62% |
| 24 | 347 | 1,500 | 23.13% | 21.07%–25.33% |
| 25 | 300 | 1,500 | 20% | 18.05%–22.1% |
| 26 | 245 | 1,500 | 16.33% | 14.55%–18.29% |
| 27 | 196 | 1,500 | 13.07% | 11.45%–14.87% |
| 28 | 152 | 1,500 | 10.13% | 8.71%–11.76% |
| 29 | 107 | 1,500 | 7.13% | 5.94%–8.55% |
| 30 | 55 | 1,500 | 3.67% | 2.83%–4.74% |
| Position on the road | Successful rounds | Rounds in this demo run | Share of these rounds reaching the position | Range around this proportion |
|---|---|---|---|---|
| 1 | 1,345 | 1,500 | 89.67% | 88.02%–91.11% |
| 2 | 1,179 | 1,500 | 78.6% | 76.45%–80.6% |
| 3 | 1,053 | 1,500 | 70.2% | 67.84%–72.46% |
| 4 | 926 | 1,500 | 61.73% | 59.25%–64.16% |
| 5 | 807 | 1,500 | 53.8% | 51.27%–56.31% |
| 6 | 705 | 1,500 | 47% | 44.49%–49.53% |
| 7 | 621 | 1,500 | 41.4% | 38.93%–43.91% |
| 8 | 543 | 1,500 | 36.2% | 33.81%–38.66% |
| 9 | 461 | 1,500 | 30.73% | 28.45%–33.11% |
| 10 | 380 | 1,500 | 25.33% | 23.2%–27.6% |
| 11 | 321 | 1,500 | 21.4% | 19.4%–23.55% |
| 12 | 264 | 1,500 | 17.6% | 15.76%–19.61% |
| 13 | 210 | 1,500 | 14% | 12.34%–15.85% |
| 14 | 172 | 1,500 | 11.47% | 9.95%–13.18% |
| 15 | 134 | 1,500 | 8.93% | 7.59%–10.48% |
| 16 | 94 | 1,500 | 6.27% | 5.15%–7.61% |
| 17 | 76 | 1,500 | 5.07% | 4.07%–6.3% |
| 18 | 54 | 1,500 | 3.6% | 2.77%–4.67% |
| 19 | 42 | 1,500 | 2.8% | 2.08%–3.76% |
| 20 | 31 | 1,500 | 2.07% | 1.46%–2.92% |
| 21 | 18 | 1,500 | 1.2% | 0.76%–1.89% |
| 22 | 7 | 1,500 | 0.47% | 0.23%–0.96% |
| 23 | 4 | 1,500 | 0.27% | 0.1%–0.68% |
| 24 | 1 | 1,500 | 0.07% | 0.01%–0.38% |
| 25 | 0 | 1,500 | 0% | 0%–0.26% |
| Position on the road | Successful rounds | Rounds in this demo run | Share of these rounds reaching the position | Range around this proportion |
|---|---|---|---|---|
| 1 | 1,225 | 1,500 | 81.67% | 79.63%–83.54% |
| 2 | 970 | 1,500 | 64.67% | 62.21%–67.05% |
| 3 | 780 | 1,500 | 52% | 49.47%–54.52% |
| 4 | 616 | 1,500 | 41.07% | 38.6%–43.58% |
| 5 | 468 | 1,500 | 31.2% | 28.91%–33.59% |
| 6 | 355 | 1,500 | 23.67% | 21.58%–25.88% |
| 7 | 258 | 1,500 | 17.2% | 15.37%–19.19% |
| 8 | 196 | 1,500 | 13.07% | 11.45%–14.87% |
| 9 | 142 | 1,500 | 9.47% | 8.09%–11.05% |
| 10 | 96 | 1,500 | 6.4% | 5.27%–7.75% |
| 11 | 70 | 1,500 | 4.67% | 3.71%–5.85% |
| 12 | 51 | 1,500 | 3.4% | 2.6%–4.44% |
| 13 | 29 | 1,500 | 1.93% | 1.35%–2.76% |
| 14 | 17 | 1,500 | 1.13% | 0.71%–1.81% |
| 15 | 8 | 1,500 | 0.53% | 0.27%–1.05% |
| 16 | 5 | 1,500 | 0.33% | 0.14%–0.78% |
| 17 | 2 | 1,500 | 0.13% | 0.04%–0.48% |
| 18 | 2 | 1,500 | 0.13% | 0.04%–0.48% |
| 19 | 1 | 1,500 | 0.07% | 0.01%–0.38% |
| 20 | 0 | 1,500 | 0% | 0%–0.26% |
| 21 | 0 | 1,500 | 0% | 0%–0.26% |
| 22 | 0 | 1,500 | 0% | 0%–0.26% |
| Position on the road | Successful rounds | Rounds in this demo run | Share of these rounds reaching the position | Range around this proportion |
|---|---|---|---|---|
| 1 | 1,016 | 1,500 | 67.73% | 65.32%–70.05% |
| 2 | 646 | 1,500 | 43.07% | 40.58%–45.59% |
| 3 | 426 | 1,500 | 28.4% | 26.18%–30.73% |
| 4 | 271 | 1,500 | 18.07% | 16.2%–20.09% |
| 5 | 161 | 1,500 | 10.73% | 9.27%–12.4% |
| 6 | 92 | 1,500 | 6.13% | 5.03%–7.46% |
| 7 | 56 | 1,500 | 3.73% | 2.89%–4.82% |
| 8 | 34 | 1,500 | 2.27% | 1.63%–3.15% |
| 9 | 17 | 1,500 | 1.13% | 0.71%–1.81% |
| 10 | 9 | 1,500 | 0.6% | 0.32%–1.14% |
| 11 | 5 | 1,500 | 0.33% | 0.14%–0.78% |
| 12 | 2 | 1,500 | 0.13% | 0.04%–0.48% |
| 13 | 1 | 1,500 | 0.07% | 0.01%–0.38% |
| 14 | 0 | 1,500 | 0% | 0%–0.26% |
| 15 | 0 | 1,500 | 0% | 0%–0.26% |
| 16 | 0 | 1,500 | 0% | 0%–0.26% |
| 17 | 0 | 1,500 | 0% | 0%–0.26% |
| 18 | 0 | 1,500 | 0% | 0%–0.26% |
Demo observations. No forecasts. No independent RTP audit.
Model: RTP ÷ multiplier. Independently unverified.
| Position on the road | Share of these rounds reaching the position | Range around this proportion | Survival under the stated model |
|---|---|---|---|
| 1 | 95.47% | 94.29% – 96.41% | 95.15% |
| 2 | 91.13% | 89.59% – 92.47% | 91.59% |
| 3 | 87.73% | 85.98% – 89.3% | 87.5% |
| 4 | 83.07% | 81.08% – 84.88% | 83.76% |
| 5 | 78.4% | 76.25% – 80.41% | 79.67% |
| 6 | 74.13% | 71.86% – 76.29% | 75.97% |
| 7 | 70.27% | 67.9% – 72.53% | 72.06% |
| 8 | 66.67% | 64.24% – 69.01% | 68.06% |
| 9 | 62.47% | 59.99% – 64.88% | 64.05% |
| 10 | 57.33% | 54.81% – 59.81% | 60.12% |
| 11 | 54.2% | 51.67% – 56.71% | 56% |
| 12 | 51.07% | 48.54% – 53.59% | 52.13% |
| 13 | 47.07% | 44.55% – 49.6% | 48.04% |
| 14 | 43.27% | 40.78% – 45.79% | 44.14% |
| 15 | 39.67% | 37.22% – 42.17% | 40% |
| 16 | 35.87% | 33.48% – 38.33% | 36.03% |
| 17 | 32.93% | 30.6% – 35.35% | 32.03% |
| 18 | 28.87% | 26.63% – 31.21% | 28% |
| 19 | 24.6% | 22.49% – 26.84% | 24.02% |
| 20 | 21% | 19.01% – 23.13% | 20% |
| 21 | 16.13% | 14.36% – 18.08% | 15.99% |
| 22 | 12.67% | 11.08% – 14.45% | 14.83% |
| 23 | 9% | 7.65% – 10.55% | 9.99% |
| 24 | 4.87% | 3.89% – 6.08% | 5.04% |
| Position on the road | Share of these rounds reaching the position | Range around this proportion | Survival under the stated model |
|---|---|---|---|
| 1 | 87.8% | 86.05% – 89.36% | 87.5% |
| 2 | 77.27% | 75.08% – 79.32% | 76.56% |
| 3 | 66.8% | 64.38% – 69.14% | 66.67% |
| 4 | 57.13% | 54.61% – 59.62% | 57.65% |
| 5 | 48.53% | 46.01% – 51.06% | 49.49% |
| 6 | 41% | 38.54% – 43.51% | 42.06% |
| 7 | 34.6% | 32.23% – 37.04% | 35.51% |
| 8 | 28.4% | 26.18% – 30.73% | 29.52% |
| 9 | 22.8% | 20.75% – 24.99% | 24.32% |
| 10 | 17.73% | 15.88% – 19.75% | 19.76% |
| 11 | 13.93% | 12.27% – 15.78% | 15.81% |
| 12 | 10.93% | 9.45% – 12.61% | 14.18% |
| 13 | 8.8% | 7.47% – 10.34% | 11.01% |
| 14 | 6.47% | 5.33% – 7.83% | 8.35% |
| 15 | 4.4% | 3.47% – 5.56% | 6.13% |
| 16 | 3.47% | 2.65% – 4.52% | 4.33% |
| 17 | 2.33% | 1.68% – 3.23% | 2.92% |
| 18 | 1.67% | 1.13% – 2.45% | 1.84% |
| 19 | 0.8% | 0.46% – 1.39% | 1.06% |
| 20 | 0.53% | 0.27% – 1.05% | 0.54% |
| 21 | 0.2% | 0.07% – 0.59% | 0.22% |
| 22 | 0.07% | 0.01% – 0.38% | 0.05% |
| Position on the road | Share of these rounds reaching the position | Range around this proportion | Survival under the stated model |
|---|---|---|---|
| 1 | 81.67% | 79.63% – 83.54% | 79.67% |
| 2 | 65.87% | 63.43% – 68.22% | 63.23% |
| 3 | 52.8% | 50.27% – 55.32% | 49.49% |
| 4 | 39.6% | 37.15% – 42.1% | 38.28% |
| 5 | 29.4% | 27.15% – 31.76% | 29.17% |
| 6 | 20.8% | 18.82% – 22.93% | 21.83% |
| 7 | 15.87% | 14.11% – 17.8% | 17.85% |
| 8 | 10.4% | 8.96% – 12.05% | 13.01% |
| 9 | 6.27% | 5.15% – 7.61% | 9.28% |
| 10 | 4.6% | 3.65% – 5.78% | 6.44% |
| 11 | 3.2% | 2.42% – 4.22% | 4.34% |
| 12 | 2.07% | 1.46% – 2.92% | 2.82% |
| 13 | 1.53% | 1.02% – 2.29% | 1.75% |
| 14 | 0.73% | 0.41% – 1.31% | 1.03% |
| 15 | 0.4% | 0.18% – 0.87% | 0.57% |
| 16 | 0.27% | 0.1% – 0.68% | 0.29% |
| 17 | 0.07% | 0.01% – 0.38% | 0.13% |
| 18 | 0.07% | 0.01% – 0.38% | 0.05% |
| 19 | 0% | 0% – 0.26% | 0.01% |
| 20 | 0% | 0% – 0.26% | 0% |
| Position on the road | Share of these rounds reaching the position | Range around this proportion | Survival under the stated model |
|---|---|---|---|
| 1 | 59.4% | 56.89% – 61.86% | 60.12% |
| 2 | 34.4% | 32.04% – 36.84% | 35% |
| 3 | 19.4% | 17.48% – 21.48% | 19.8% |
| 4 | 11.6% | 10.08% – 13.32% | 10.79% |
| 5 | 6.53% | 5.39% – 7.9% | 6.44% |
| 6 | 3.8% | 2.94% – 4.89% | 3.25% |
| 7 | 1.73% | 1.19% – 2.53% | 1.56% |
| 8 | 0.87% | 0.51% – 1.48% | 0.7% |
| 9 | 0.33% | 0.14% – 0.78% | 0.29% |
| 10 | 0.13% | 0.04% – 0.48% | 0.11% |
| 11 | 0% | 0% – 0.26% | 0.04% |
| 12 | 0% | 0% – 0.26% | 0.01% |
| 13 | 0% | 0% – 0.26% | 0% |
| 14 | 0% | 0% – 0.26% | 0% |
| 15 | 0% | 0% – 0.26% | 0% |
| Position on the road | Share of these rounds reaching the position | Range around this proportion | Survival under the stated model |
|---|---|---|---|
| 1 | 96.2% | 95.11% – 97.06% | 94.55% |
| 2 | 93.93% | 92.61% – 95.03% | 92.72% |
| 3 | 90.53% | 88.95% – 91.91% | 90.09% |
| 4 | 87.27% | 85.48% – 88.86% | 86.82% |
| 5 | 83.13% | 81.15% – 84.94% | 83.04% |
| 6 | 80.13% | 78.04% – 82.07% | 80.25% |
| 7 | 76.53% | 74.32% – 78.61% | 77.02% |
| 8 | 73.53% | 71.24% – 75.7% | 73.46% |
| 9 | 70.6% | 68.24% – 72.85% | 70.74% |
| 10 | 66.73% | 64.31% – 69.07% | 67.25% |
| 11 | 63.67% | 61.2% – 66.06% | 64.53% |
| 12 | 60.67% | 58.17% – 63.11% | 61.22% |
| 13 | 57.2% | 54.68% – 59.68% | 57.88% |
| 14 | 54.2% | 51.67% – 56.71% | 54.57% |
| 15 | 51.2% | 48.67% – 53.72% | 51.62% |
| 16 | 48.13% | 45.61% – 50.66% | 48.23% |
| 17 | 45.33% | 42.83% – 47.86% | 45.05% |
| 18 | 42.67% | 40.19% – 45.19% | 41.89% |
| 19 | 39.53% | 37.09% – 42.03% | 38.66% |
| 20 | 36.47% | 34.07% – 38.93% | 35.37% |
| 21 | 33% | 30.67% – 35.42% | 32.26% |
| 22 | 30.13% | 27.86% – 32.5% | 29.12% |
| 23 | 26.33% | 24.17% – 28.62% | 25.81% |
| 24 | 23.13% | 21.07% – 25.33% | 23.24% |
| 25 | 20% | 18.05% – 22.1% | 20.58% |
| 26 | 16.33% | 14.55% – 18.29% | 17.72% |
| 27 | 13.07% | 11.45% – 14.87% | 14.69% |
| 28 | 10.13% | 8.71% – 11.76% | 11.42% |
| 29 | 7.13% | 5.94% – 8.55% | 7.91% |
| 30 | 3.67% | 2.83% – 4.74% | 4.11% |
| Position on the road | Share of these rounds reaching the position | Range around this proportion | Survival under the stated model |
|---|---|---|---|
| 1 | 89.67% | 88.02% – 91.11% | 88.43% |
| 2 | 78.6% | 76.45% – 80.6% | 78.93% |
| 3 | 70.2% | 67.84% – 72.46% | 69.71% |
| 4 | 61.73% | 59.25% – 64.16% | 61.22% |
| 5 | 53.8% | 51.27% – 56.31% | 53.65% |
| 6 | 47% | 44.49% – 49.53% | 46.59% |
| 7 | 41.4% | 38.93% – 43.91% | 40.3% |
| 8 | 36.2% | 33.81% – 38.66% | 34.48% |
| 9 | 30.73% | 28.45% – 33.11% | 29.48% |
| 10 | 25.33% | 23.2% – 27.6% | 24.81% |
| 11 | 21.4% | 19.4% – 23.55% | 20.67% |
| 12 | 17.6% | 15.76% – 19.61% | 17.02% |
| 13 | 14% | 12.34% – 15.85% | 13.82% |
| 14 | 11.47% | 9.95% – 13.18% | 11.05% |
| 15 | 8.93% | 7.59% – 10.48% | 8.69% |
| 16 | 6.27% | 5.15% – 7.61% | 6.68% |
| 17 | 5.07% | 4.07% – 6.3% | 5.04% |
| 18 | 3.6% | 2.77% – 4.67% | 3.66% |
| 19 | 2.8% | 2.08% – 3.76% | 2.56% |
| 20 | 2.07% | 1.46% – 2.92% | 1.77% |
| 21 | 1.2% | 0.76% – 1.89% | 1.16% |
| 22 | 0.47% | 0.23% – 0.96% | 0.69% |
| 23 | 0.27% | 0.1% – 0.68% | 0.36% |
| 24 | 0.07% | 0.01% – 0.38% | 0.15% |
| 25 | 0% | 0% – 0.26% | 0.04% |
| Position on the road | Share of these rounds reaching the position | Range around this proportion | Survival under the stated model |
|---|---|---|---|
| 1 | 81.67% | 79.63% – 83.54% | 80.93% |
| 2 | 64.67% | 62.21% – 67.05% | 65.41% |
| 3 | 52% | 49.47% – 54.52% | 52.19% |
| 4 | 41.07% | 38.6% – 43.58% | 41.34% |
| 5 | 31.2% | 28.91% – 33.59% | 32.37% |
| 6 | 23.67% | 21.58% – 25.88% | 25% |
| 7 | 17.2% | 15.37% – 19.19% | 19.02% |
| 8 | 13.07% | 11.45% – 14.87% | 14.34% |
| 9 | 9.47% | 8.09% – 11.05% | 10.56% |
| 10 | 6.4% | 5.27% – 7.75% | 7.63% |
| 11 | 4.67% | 3.71% – 5.85% | 5.38% |
| 12 | 3.4% | 2.6% – 4.44% | 3.7% |
| 13 | 1.93% | 1.35% – 2.76% | 2.47% |
| 14 | 1.13% | 0.71% – 1.81% | 1.59% |
| 15 | 0.53% | 0.27% – 1.05% | 0.98% |
| 16 | 0.33% | 0.14% – 0.78% | 0.57% |
| 17 | 0.13% | 0.04% – 0.48% | 0.31% |
| 18 | 0.13% | 0.04% – 0.48% | 0.16% |
| 19 | 0.07% | 0.01% – 0.38% | 0.07% |
| 20 | 0% | 0% – 0.26% | 0.03% |
| 21 | 0% | 0% – 0.26% | 0.01% |
| 22 | 0% | 0% – 0.26% | 0% |
| Position on the road | Share of these rounds reaching the position | Range around this proportion | Survival under the stated model |
|---|---|---|---|
| 1 | 67.73% | 65.32% – 70.05% | 66.32% |
| 2 | 43.07% | 40.58% – 45.59% | 43.21% |
| 3 | 28.4% | 26.18% – 30.73% | 27.68% |
| 4 | 18.07% | 16.2% – 20.09% | 17.27% |
| 5 | 10.73% | 9.27% – 12.4% | 10.51% |
| 6 | 6.13% | 5.03% – 7.46% | 6.24% |
| 7 | 3.73% | 2.89% – 4.82% | 3.57% |
| 8 | 2.27% | 1.63% – 3.15% | 1.96% |
| 9 | 1.13% | 0.71% – 1.81% | 1.03% |
| 10 | 0.6% | 0.32% – 1.14% | 0.52% |
| 11 | 0.33% | 0.14% – 0.78% | 0.24% |
| 12 | 0.13% | 0.04% – 0.48% | 0.11% |
| 13 | 0.07% | 0.01% – 0.38% | 0.04% |
| 14 | 0% | 0% – 0.26% | 0.02% |
| 15 | 0% | 0% – 0.26% | 0.01% |
| 16 | 0% | 0% – 0.26% | 0% |
| 17 | 0% | 0% – 0.26% | 0% |
| 18 | 0% | 0% – 0.26% | 0% |